

BTCUSD Medium-term Trend: Ranging
Resistance levels: $6,500, $6,600, $6,700
Support levels: $6,300, $6,200, $6,100
Yesterday, the BTC price was in a sideways trend when it had a bullish movement that broke the $6,600 price level. The breakout led the price to reach the high of $ 6,880.72. However, the bulls could not hold on to the higher level of price and the bears pulled back below the support of $6,711. Today, the BTC price is now fluctuating between the levels of $6,600 and $6,000.
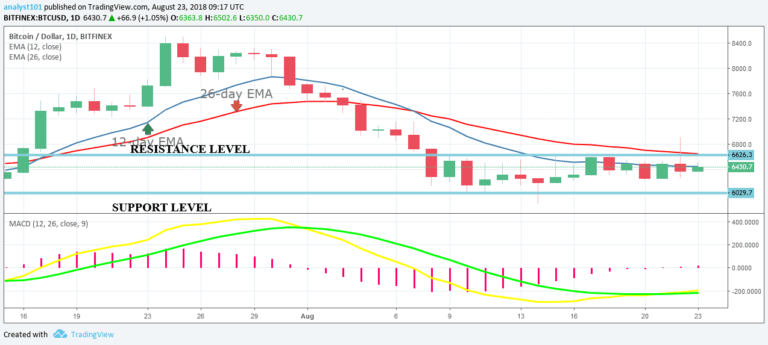
The price of Bitcoin will fluctuate in the range bound levels and the bears will likely test the support level at $6,000. If the bears break the support level they will revisit its previous low at $5,900. From the chart, the MACD shows signs of bearish signals. The MACD line and the signal line are below the zero line which indicates a sell signal.
Also, the price of Bitcoin is below the 12-day EMA and the 26-day EMA which indicates that a bearish trend is ongoing.
BTCUSD Short-term Trend: Ranging

On the 4-hour chart, the BTC price is range bound. The price of Bitcoin is now ranging between the range-bound levels of $6,600 and $6,000. The BTC price is ranging below the exponential moving averages. Meanwhile, the Relative Strength Index period 14 is level 49 which indicates that price is in the range bound zone.
The views and opinions expressed here do not reflect that of CryptoGlobe.com and do not constitute financial advice. Always do your own research.


