

BTCUSD Medium-term Trend: Ranging
Resistance levels: $6,500, $6,600, $6,700
Support levels: $6,300, $6,200, $6,100
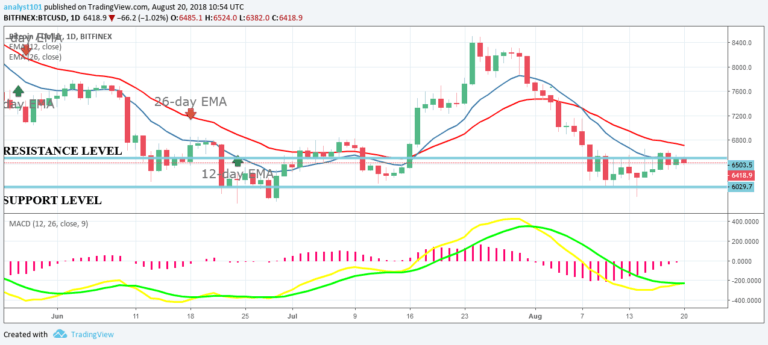
Last week the price of Bitcoin had been in a range bound movement. On August 14th, the BTC price fell to the low of $5,980.31 and the cryptocurrency began its bullish movement to the $6,600 price level. August 9th was the first time the bulls made a concerted efforts to break the resistance level at $ 6,600. Now the BTC price is range-bound between the levels of $6,000 and $,6,600.
A breakout is imminent for the price of Bitcoin. However, if the price of Bitcoin retraces from the resistance level, a short trade can be taken. Then a stop loss above the $6,600 price level to guide against any bullish breakout. Traders can exit their short trades at the support zone. However, if the price gets to the support level, you can take a long trade and stop-loss order below the $6000 price level.
Traders can exit long trades near the resistance zone. On the chart, the MACD line and the signal line are below the zero line which indicates a sell signal. The price of Bitcoin is below the 12-day EMA and the 26-day EMA which indicates that the price was falling.
BTCUSD Short-term Trend: Ranging

On the 4-hour chart, the BTC price is ranging at the price of $ 6,453. Meanwhile, the Relative Strength Index period 14 is level 51 which indicates that the price is in the range bound trend zone.
The views and opinions expressed here do not reflect that of CryptoGlobe.com and do not constitute financial advice. Always do your own research.


