

Bitcoin Price Medium-term Trend: Bearish
Resistance levels: $7,600, $7,700, $7,200
Support levels: $7,800, $7,700, $7,600
Yesterday, July 31st, the BTC price was in a bearish trend. After their initial trial, the bulls fail to break the $8,500 price level but lost control to the bears who brought the price to its previous low – falling to $7615 at the time of writing. The bears might have exhausted their selling pressure because the price has reached the support zone.
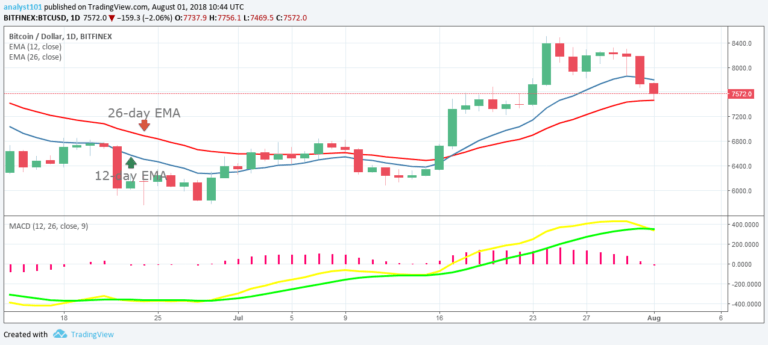
The support zone includes prices from $7,400 to $7,600. Traders can initiate long trades in this zone and a stop loss at the $7,400 price level. When positions are taken up in this manner, the price will pick up momentum above the resistance level of $8,500. Meanwhile, the MACD line and the signal line are above the zero line which indicates a buy signal for the BTC price.
The bitcoin price is above the 12-day EMA and the 26-day EMA which indicates that the bullish trend might be ongoing.
Bitcoin Price Short-term Trend: Bearish

On the 4-hour chart, the Bitcoin price is in a bearish trend. The BTC price fell to the low of $7,563.10 and resume a range bound movement. In the other words, there was price consolidation at that level. Meanwhile, the Relative Strength Index period 14 is level 26 which indicates that the market is oversold suggesting bulls might control of the market.
The views and opinions expressed here do not reflect that of CryptoGlobe.com and do not constitute financial advice. Always do your own research.


