
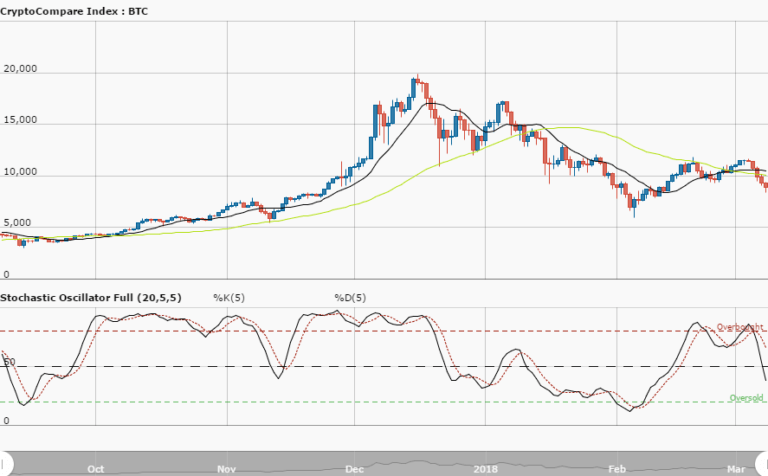
BTCUSD Long-term Trend – Bearish
Distribution territories: $8,500, $9,500, $10,500.
Accumulation territories: $5,500, $4,500, $3,500.
Over the last few weeks, the US dollar has been gaining value against the flagship cryptocurrency Bitcoin. On July 31, the cryptocurrency convincingly broke the 14-day SMA and expanded its decline to break the 50-day SMA downward, to around $6,120 on August 8.

The bears have been able to drag down the price of BTC from the distribution territory of $8,400 once again, as they eventually succeeded on May 22. The price is now under the two SMAs.
The 14-day SMA is bent south but still located above the 50-day SMA. Stochastic Oscillators have just dipped into oversold zone. They now point north, barely within the zone. This suggests there may be some longs in the market now. The current selling trend to not be over as Bitcoin is now seemingly making a correction from its last low price line towards the accumulation territory line of $6,000.
There is still a high expectation the cryptocurrency will need to be pushed southward past the accumulation territory of $6,000 or towards the accumulation territory of $5,500. Traders may look for a strong bearish reversal to enter a long position, taking proper financial precautions.
The views and opinions expressed here do not reflect that of CryptoGlobe.com and do not constitute financial advice. Always do your own research.


