

XRP Price Medium-term Trend: Ranging
Supply levels: $0.45, $0.46, $ 0.47
Demand levels: $0.43, $0.42, $0.41
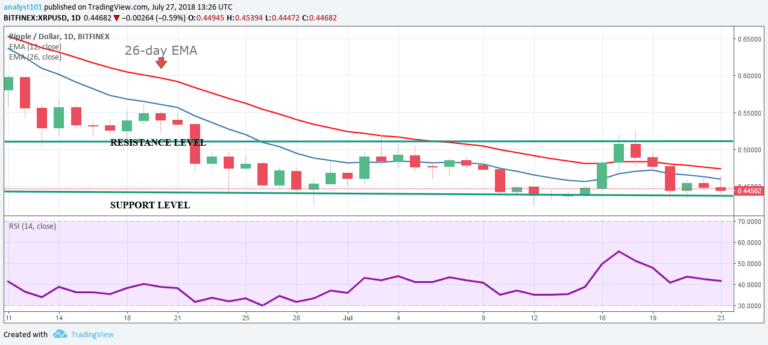
Yesterday, July 26, XRP’s price was still in the range bound zone. The cryptocurrency has been somewhat steady in the last 24 hours and is likely going to have a sudden breakout at key levels of its range bound zone. For this reason, traders can set pending orders at these key levels.
For instance, in order to trade a bearish breakout, placing a “sell stop” at $0.43 may be a good move. Similarly, to take partial profits in a bullish breakout, a stop at $0.51 would be made. The MACD and signal lines are below the zero line which indicates a sell signal. Moreover, XRP’s price is below the 12-day EMA and 26-day EMA which shows it’s still falling.
XRP Price Short-term Trend: Ranging

On the 4-hour chart, XRP is also in a range bound between the levels of $0.51 and $0.43. It’s below the 12-day EMA and the 26-day EMA, showing a bearish trend. Meanwhile, the Relative Strength Index period 14 is level 42 which indicates the price is in the range bound zone.
The views and opinions expressed here do not reflect that of CryptoGlobe.com and do not constitute financial advice. Always do your own research.


