

XRPUSD Medium-term Trend: Bearish
Supply levels: $0.47, $0.48, $ 0.49
Demand levels: $0.45, $0.44, $0.43
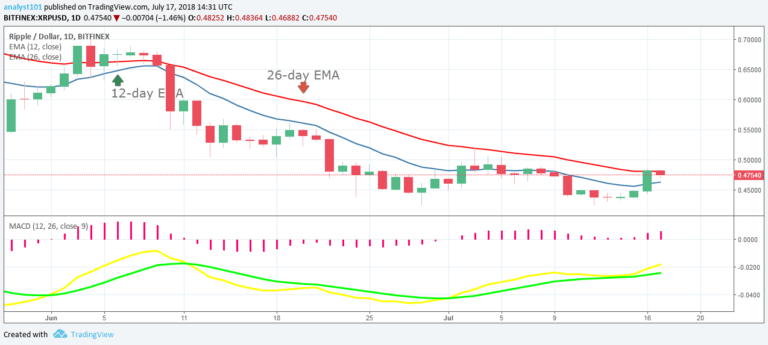
Yesterday, July 16th, the price of XRP was in a bullish trend. From the daily chart, the price of cryptocurrency has risen to the high of $0.47. The Ripple price fluctuates between the resistance level at $0.48 and the support level at $0.42. As the price reaches the high of $0.48, it might be resisted by the bears.
And the same is applicable at the support level. Traders should place short trades at the the resistance level and place long trades at the support level. From the daily chart, the MACD line and the signal line are below the zero line which indicates a sell signal. Also, the 12-day EMA and 26-day EMA are above the price bars of XRP which indicates that the bearish pressure is continuing.
XRPUSD Short-term Trend: Bullish

On the 4-hour chart, the price is in a bullish trend. The price of XRP is above the 12-day EMA and 26-day which indicates that the bullish trend is ongoing. Nevertheless, the relative strength index period 14 is level 65 which indicates that the price is in the bullish trend zone.
The views and opinions expressed here do not reflect that of CryptoGlobe.com and do not constitute financial advice. Always do your own research.


