

XRPUSD Medium-term Trend: Bearish
Supply Levels: $0.45, $0.46, $ 0.47
Demand levels: $0.42, $0.41, $0.40
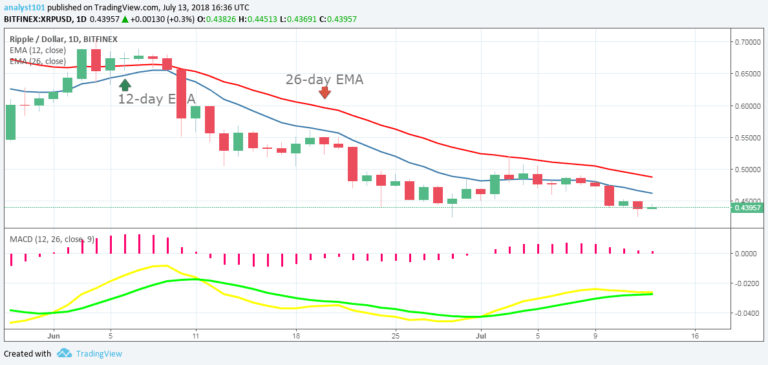
Yesterday, July 12, Ripple’s XRP was in a downward trend. In a downtrend, if a digital currency retraces, a resistance level will be created and it is likely going to depreciate further. Moreover, the 12-day EMA and the 26-day EMA are above the price which indicates that a bearish pressure is ongoing.
The MACD and the signal lines are below the zero line which indicates a sell signal.
XRPUSD Short-term Trend: Bearish

On the 4-hour chart, the XRP is still on a downward trend. Nevertheless, the relative strength index period 14 is level 39 which indicates that the market is oversold, suggesting bulls may take control of the market.
The views and opinions expressed here do not reflect that of CryptoGlobe.com and do not constitute financial advice. Always do your own research.


