

XRPUSD Medium-term Trend: Bearish
Supply Levels: $0.46, $0.47, $ 0.48
Demand levels: $0.43, $0.42, $0.41
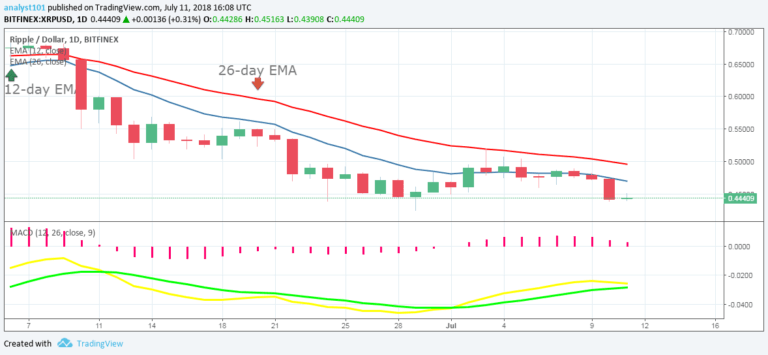
The Ripple price is in a bearish trend, falling within the resistance level at $0.52 and the support level at $0.44. The cryptocurrency will remain bearish as long as the 12-day EMA and the 26-day EMA are above the price bars.
Meanwhile, the MACD line and the signal line are below the zero line which indicates a sell signal. Also, the 12-day EMA and 26-day EMA are above the price bars which indicates that the bearish trend is ongoing.
XRPUSD Short-term Trend: Bearish

The 4-hour chart shows that Ripple was in a downward trend. The price has fallen to $0.44 and commenced a range-bound movement. The 12-day EMA and 26-day EMA are above the price bars which indicates that the bearish trend is continuing. Nevertheless, the relative strength index period 14 is level 31 which indicates that the market is oversold and suggests that the bulls will take control of the market.
The views and opinions expressed here do not reflect that of CryptoGlobe.com and do not constitute financial advice. Always do your own research.


