

XRPUSD Medium-term Trend: Bearish
Supply Levels: $0.48, $0.49, $ 0.50
Demand levels: $0.46, $0.45, $0.44
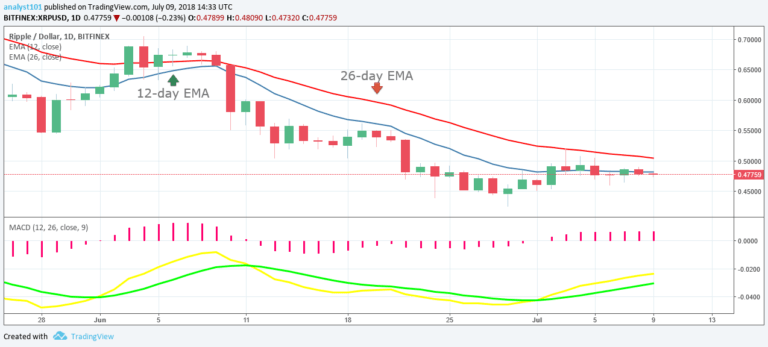
Last week price of Ripple was in a range bound trend. Today, the cryptocurrency is still in a range bound movement between the levels of $0.52 and $0.44. However, in the medium term trend, the MACD line and the signal line are below the zero line which indicates a sell signal. Also, the 26-day EMA and 12-day EMA are above the price bars of Ripple which indicates that the bearish trend is ongoing.
XRPUSD Short-term Trend: Ranging

On the 4-hour chart, price of Ripple is still in a range bound movement. The 12-day EMA and 26-day EMA are neither above nor below the price bars of Ripple which indicates that the market is in a range bound movement. The market has a choppy price action, which makes it hard to trade so patience is advised until a trend is established. Meanwhile, relative strength index period 14 is level 47 which indicates that price of Ripple is in the range bound trend zone.
The views and opinions expressed here do not reflect that of CryptoGlobe.com and do not constitute financial advice. Always do your own research.


