

XRPUSD Medium-term Trend: Ranging
Supply Levels: $0.48, $0.49, $ 0.50
Demand levels: $0.46, $0.45, $0.44
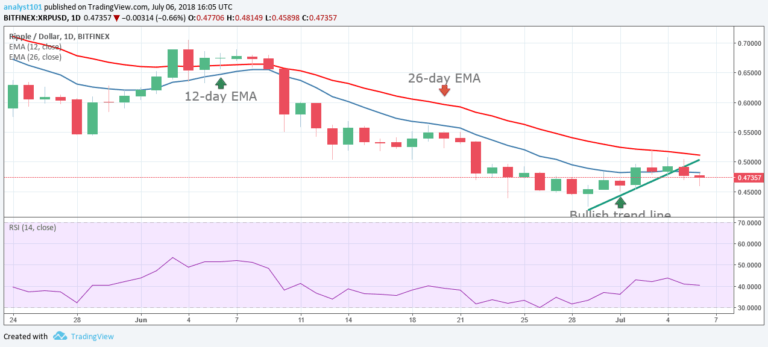
Yesterday, July 5, the Ripple price was in a bullish trend. The bullish trend was short-lived as the Ripple price went into a range-bound movement. Also, the cryptocurrency was in a downward trend that made it fall to as low as $0.42 on June 29. Later, the bulls took the Ripple price to $0.51. The price retraced from the recent high to test the trend line.
However, the bearish pressure made the trend line brake. The implication is that the short bullish movement is over. Meanwhile, the relative strength index period 14 is level 40 which indicates that the price is in a range-bound zone. The Ripple price is likely to fluctuate above the $0.45 price level until we see another breakout.
XRPUSD Short-term Trend: Bullish

On the 4-hour chart, the Ripple price is in a bearish trend. Nevertheless, the MACD line and the signal line are above the zero line which indicates a buy signal. The 12-day EMA and the 26-day EMA are above the price bars which indicates that the bearish trend continues.
The views and opinions expressed here do not reflect that of CryptoGlobe.com and do not constitute financial advice. Always do your own research.


