
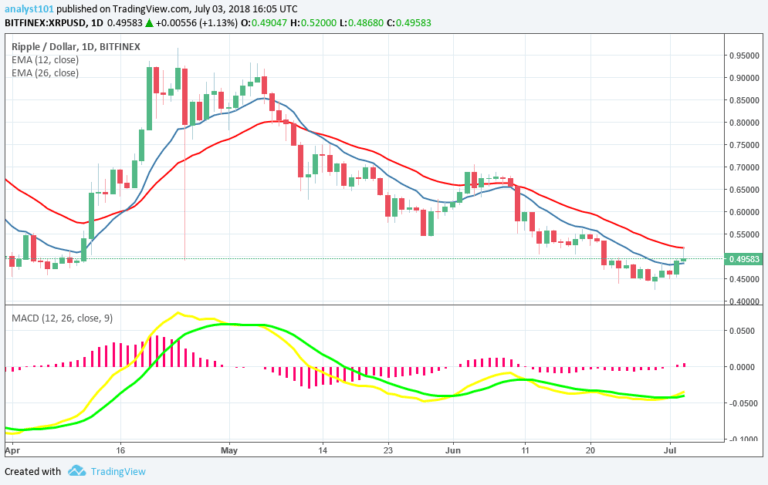

XRPUSD Medium-term Trend: Bearish
Supply Levels: $0.50, $0.51, $ 0.52
Demand levels: $0.48, $0.47, $0.46
Yesterday, July 2, Ripple price was in a bearish trend. On July 2, the bulls took price from the low of $0.45, and then to the high of $0.51. However, the bears brought price to the low of $0.49. The season of bearish pressure may soon be over as the bulls make another attempt. Meanwhile, the MACD line and the signal line are below the zero line which indicates a sell signal.
Also, the price bars of Ripple are above 12-day EMA and the 26-day EMA which indicates that the bearish trend is continuing.
XRPUSD Short-term Trend: Bullish

On the 4-hour chart, the price of Ripple is in a bullish trend. The price bars of Ripple is above the 12-day EMA and the 26-day EMA indicating that the cryptoasset is rising. Meanwhile, the relative strength index period 14 is level 60 which indicates that price of Ripple is in the bullish trend zone. In a bullish trend traders can buy low and sell high.
The views and opinions expressed here do not reflect that of CryptoGlobe.com and do not constitute financial advice. Always do your own research.


