
XRPUSD Long-term Trend – Bearish
Distribution territories: $0.80, $0.90, $1.00.
Accumulation territories: $0.30, $0.20, $0.10.
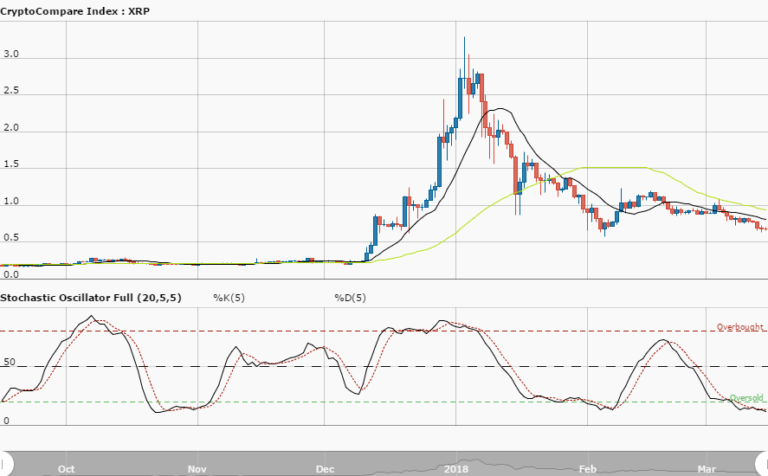
XRPUSD has been seeing more lower lows than lower highs over the past few months. The pair long-term trend can be seen as bearish as it was able to breach past the accumulation territory of $0.50, and the price has been slowly declining for quite a while. Ripple Chart by TradingView
A significant decline was experienced on July 10. The 50-day SMA is located above the 14-day SMA as the price is now headed south towards the accumulation territory of $0.40. The Stochastic Oscillators have gone below range 40 and touched range 20.
This suggests that the price could still go further south. It appears the cryptocurrency’s long-term trend is still going to continue bearish for the next few days or weeks. The formation of lower lows may lead to the appearance of a confluence of short Japanese candlesticks below the current trend-line of the 14-day SMA.
Traders and investors can potentially enter long positions when the market shows strong reversal signs from the bearish trend.
The views and opinions expressed here do not reflect that of CryptoGlobe.com and do not constitute financial advice. Always do your own research.


