

LTCUSD Medium-term Trend: Bearish
Resistance Levels: $90, $92, $94
Support Levels: $86, $84, $84
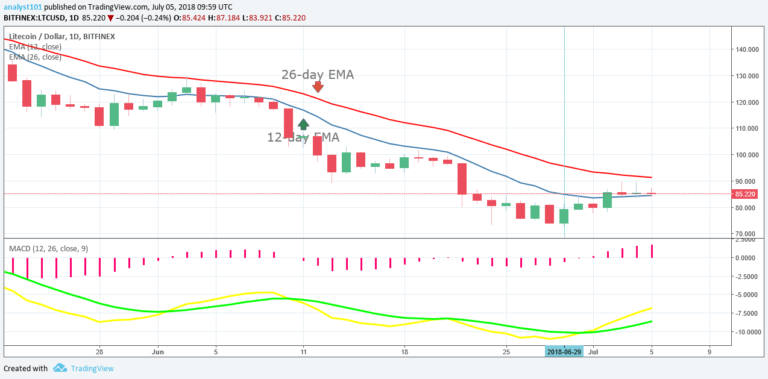
Yesterday, July 4, price of Litecoin was in a bullish trend. The downward trend of the cryptoasset ended on June 29 at a closing price of $74.01. Whereas the bullish trend ended on July 3 at a price of $87.59. Presently, the cryptoasset is in a downward trend in the medium term.
Nevertheless, the MACD line and the signal line are below the zero line which indicates a sell signal. Also, the 12-day EMA and the 26-day EMA are above the price bars of Litecoin which indicates that the bearish trend is continuing.
LTCUSD Short-term Trend: Bullish

On the 4-hour chart, the price of Litecoin is in a bullish trend but the price of the cryptoasset has broken the bullish trend line. The implication of this price action is that the bullish trend is as good as over because of the broken trend line. The cryptoasset may fall to its previous low or move in a range bound movement.
The views and opinions expressed here do not reflect that of CryptoGlobe.com and do not constitute financial advice. Always do your own research.


