

LTCUSD Medium-term Trend: Bearish
Resistance Levels: $90, $92, $94
Support Levels: $86, $84, $84
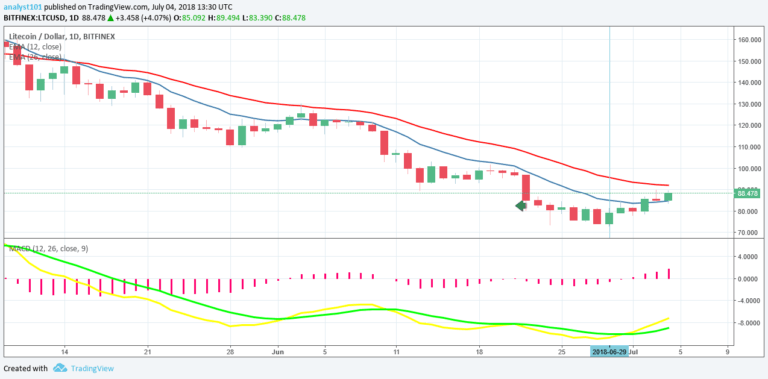
Yesterday, July 3, the price of Litecoin was in a bullish trend. However, the 12-day EMA and the 26-day EMA are trending southward. The MACD line and the signal line are still below the zero line which indicates a sell signal.
Also, the 12-day EMA and the 26-day EMA are above the price bars of Litecoin which indicates that the bearish trend is continuing.
LTCUSD Short-term Trend: Bullish

On the 4-hour chart, the price of Litecoin is in a bullish trend. As the price of Litecoin is bullish, traders should look out for buy setups. A bullish trend line is attached to the chart to enable us to determine the support levels for the Litecoin price. Nevertheless, if the price of Litecoin retraces from the recent high and tests the bullish trend line, then we can initiate long orders.
You can see the red bearish candlestick testing the trend line. You must allow the red bearish candlestick to close and a green bullish candlestick to open before initiating a long trade.
The views and opinions expressed here do not reflect that of CryptoGlobe.com and do not constitute financial advice. Always do your own research.


