
 Litecoin Chart by Trading View
Litecoin Price Medium-term Trend: Ranging
Resistance Levels: $83, $84, $85
Support Levels: $81, $80, $79
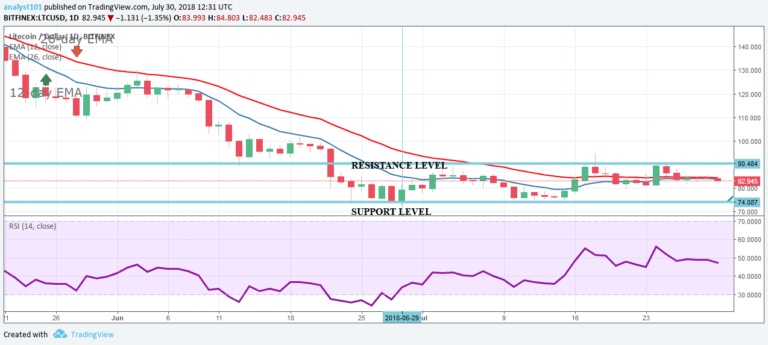
Last week, the price of Litecoin had been in a range bound movement. The market for the LTCUSD pair had been quiet. The bulls had attempted to break the resistance level at $90 but were resisted by the bears on July 24th. A breakout of LTC at the key levels might be imminent. If the bulls break the resistance level at $90, the LTC price will reach the highs of $107.87 or $118.95.
On the other hand, if the bears succeed in breaking the support level at $74, then the price will fall to the lows of either $68.48 or $56.01. Meanwhile, the MACD line and the signal line are at par with the zero line which indicates a neutral signal. Also, the 12-day EMA and the 26-day EMA are neither above nor below the price of Litecoin indicating that price is in a range-bound movement.
Litecoin Price Short-term Trend: Ranging
 Litecoin Chart by Trading View
On the 4-hour chart, the price of Litecoin is range-bound and moving in a horizontal pattern. The Relative Strength Index period 14 is level 42 which indicates that price is in the range-bound trend zone.
The views and opinions expressed here do not reflect that of CryptoGlobe.com and do not constitute financial advice. Always do your own research.


