
 Litecoin Chart by Trading View
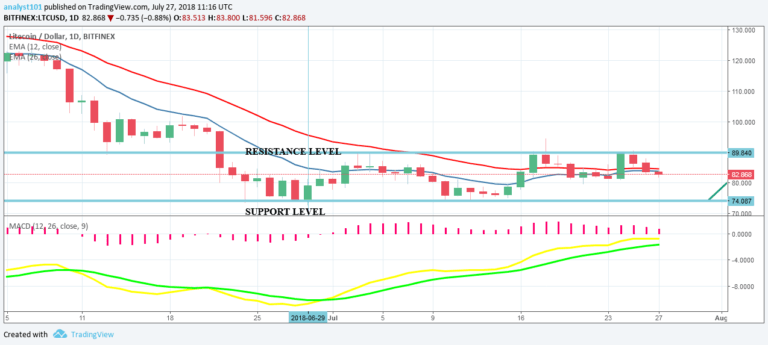
Litecoin Price Medium-term Trend: Ranging
Resistance Levels: $85, $88, $91
Support Levels: $81, $78, $75
The LTC price continues with its range-bound movement and has been fluctuating evenly between the key levels of the range-bound zone. If the LTC price tests the support level, you should initiate a long trade and a stop loss below the support level. Then you exit and take your partial profits near the resistance level. On the other hand, if the price tests the resistance level, you take a short trade and a stop loss above the resistance level. Then you exit and take your partial profits near the support zone. Meanwhile, the MACD line and the signal line are at par with the zero line which indicates a neutral signal.
Also, the 12-day EMA and the 26-day EMA are neither above nor below the Litecoin price indicating that it’s in a range-bound movement.
Litecoin Price Short-term Trend: Ranging
 Litecoin Chart by Trading View
The 4-hour chart shows that Litecoin is still in a range-bound movement. The price is below the 12-day EMA and the 26-day EMA indicating that it’s falling, The RSI period 14 is level 42 which shows that the price is in the range-bound trend zone.
The views and opinions expressed here do not reflect that of CryptoGlobe.com and do not constitute financial advice. Always do your own research.


