
 Litecoin Chart by Trading View
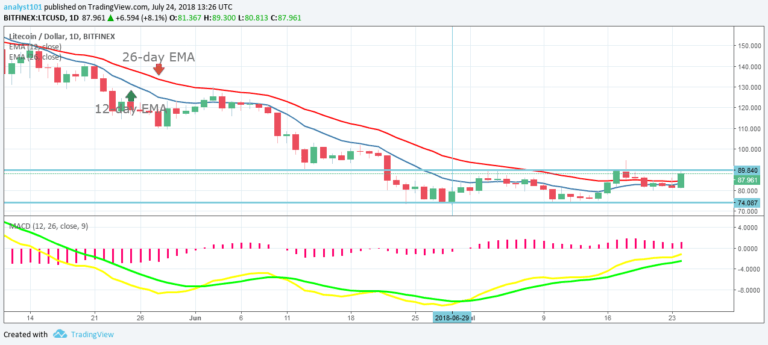
Litecoin Price Medium-term Trend: Ranging
Resistance Levels: $90, $91, $92
Support Levels: $87, $86, $85
Yesterday, July 23rd, the price of Litecoin is range bound between the levels of $89 and $74. The Litecoin price became range-bound when it fell to the low of $74 on June 28. Price of the cryptocurrency had been fluctuating between those levels. Meanwhile, the MACD line and the signal line are below the zero line which indicates a sell signal.
Also, the 12-day EMA and the 26-day EMA are neither above nor below the price of Litecoin indicating that price is in a range bound movement.
Litecoin Price Short-term Trend: Ranging
 Litecoin Chart by Trading View
On the 4-hour chart, we see expanded view of the range bound movement. The levels of resistance and support are evenly apart. Traders should take short trades when price gets to the resistance zone. Then you place a stop loss above the resistance level and you take your partial profits when you exit near the support zone.
Similarly, when the price gets to the support level you take a long trade and place a stop loss below the support level. Then you exit near the resistance zone.
The views and opinions expressed here do not reflect that of CryptoGlobe.com and do not constitute financial advice. Always do your own research.


