
 Litecoin Chart by Trading View
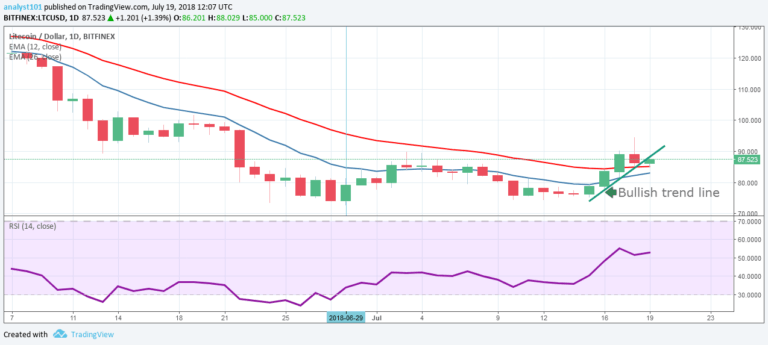
LTCUSD Medium-term Trend: Ranging
Resistance Levels: $87, $89, $91
Support Levels: $84, $82, $80
Yesterday, July 18th, the price of Litecoin was bearish after a bullish movement. From the chart, the price of Litecoin has broken the trend line and the candlestick closed on the opposite of the trend line. The current bullish trend is likely to change to a ranging trend. Meanwhile, relative strength index period 14 is level 53 which indicates that price is in the range bound trend zone.
LTCUSD Short-term Trend: Bullish
 Litecoin Chart by Trading View
On the 4-hour chart, the price of Litecoin is in a bullish trend. Price of Litecoin makes an attempt to resume its bullish movement. If the trend line breakout is false, the price will come back to its original position. Meanwhile, the MACD line and the signal line are above the zero line which indicates a buy signal.
Also, the price of Litecoin is above the 12-day EMA and the 26-day EMA which indicates that the bullish trend is ongoing.
The views and opinions expressed here do not reflect that of CryptoGlobe.com and do not constitute financial advice. Always do your own research.


