
 Litecoin Chart by Trading View
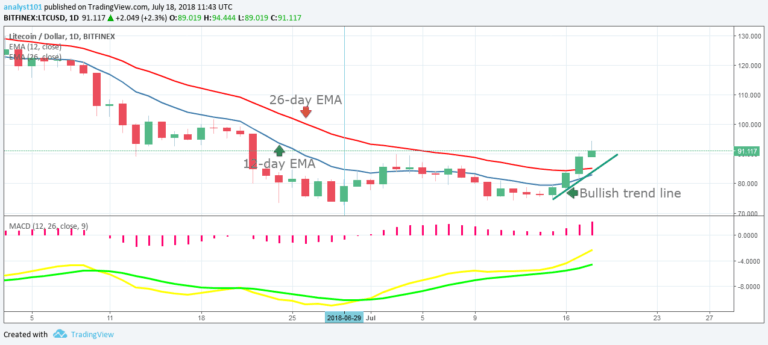
LTCUSD Medium-term Trend: Bullish
Resistance Levels: $83, $85, $87
Support Levels: $80, $78, $76
Yesterday, July 17, Litecoin was in a bullish trend. The last bearish movement was on July 12 at a price of $75.53 and this was to break the support level at $74.01. The bulls took control of the cryptocurrency’s price and broke the resistance level at $85. Litecoin is now out of the range-bound zone of $85 and $75.
Litecoin’s bearish chart is now seemingly turning bullish. Meanwhile, the MACD and the signal lines are almost at zero. The cryptocurrency’s price is above the 12-day EMA and the 26-day EMA which indicates that the bullish trend is ongoing.
LTCUSD Short-term Trend: Bullish
 Litecoin Chart by Trading View
On the 4-hour chart, the price of Litecoin is in a bullish trend. A bullish trend line is attached to the chart. In the uptrend, Litecoin made a series of higher highs and higher lows. As the price makes higher lows and tests the trend line, traders can enter long trades. Meanwhile, the relative strength index period 14 is level 75 which indicates that the market is overbought suggesting bears may take over.
The views and opinions expressed here do not reflect that of CryptoGlobe.com and do not constitute financial advice. Always do your own research.


