
 Litecoin Chart by Trading View
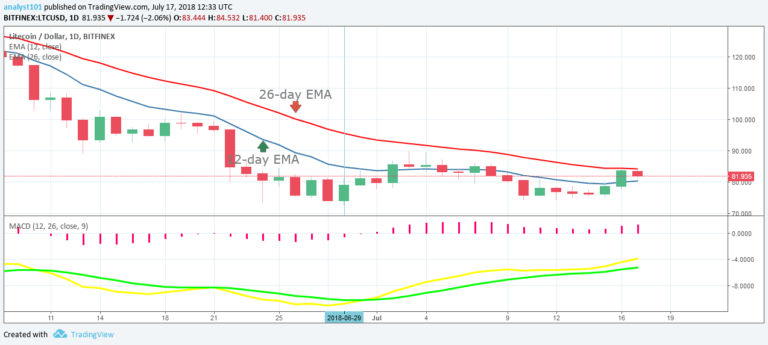
LTCUSD Medium-term Trend: Bearish
Resistance Levels: $83, $85, $87
Support Levels: $80, $78, $76
Yesterday, July 16th, the price of Litecoin was in a bullish trend following a sideways trend. The price of Litecoin is also range-bound between the levels of $85 and $75.
Traders should use the range-bound strategy to trade these digital currencies. Meanwhile, the MACD line and the signal line are below the zero line which indicates a sell signal. Also, the 12-day EMA and the 26-day EMA are above the price bars of Litecoin which indicates that the bearish trend is ongoing.
LTCUSD Short-term Trend: Bullish
Litecoin Chart by Trading View
On the 4-hour chart, the price of Litecoin is in a bullish trend. The price of Litecoin is above the exponential moving averages as the bulls took the price to the high of $85 where they were resisted. Meanwhile, the relative strength index period 14 is level 61 which indicates that the price of Litecoin is in the bullish trend-bound zone.
The views and opinions expressed here do not reflect that of CryptoGlobe.com and do not constitute financial advice. Always do your own research.


