
 Litecoin Chart by Trading View
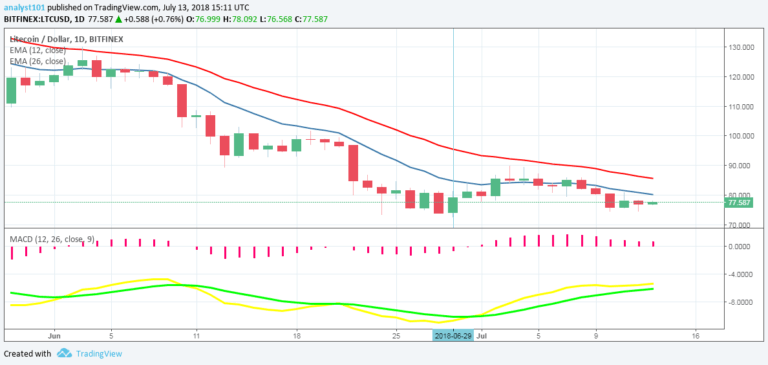
LTCUSD Medium-term Trend: Bearish
Resistance Levels: $79, $81, $83
Support Levels: $75, $73, $71
Yesterday, July 12, the price of Litecoin was in a bearish trend. The cryptocurrency has been in a smooth downward trend as it has been making lower highs and lower lows. On July 11, its price fell to a low of $76.43 but made a pullback to a high of $77. There are indicators showing LTC may still fall more.
If it falls and breaks the previous support level at $74.43, Litecoin will find support at $59.43. Meanwhile, the MACD and signal lines are below the zero line which indicates a sell signal. Also, the 12-day EMA and the 26-day EMA are above the price bars of Litecoin which indicates that a bearish trend is ongoing.
LTCUSD Short-term Trend: Bearish
 Litecoin Chart by Trading View
On the 4-hour chart, Litecoin is in a downward trend. The cryptocurrency is still bearish because the exponential moving averages are above the price bars. Meanwhile, the relative strength index period 14 is level 45 which indicates that Litecoin is in the range bound zone.
The views and opinions expressed here do not reflect that of CryptoGlobe.com and do not constitute financial advice. Always do your own research.


