
 Litecoin Chart by Trading View
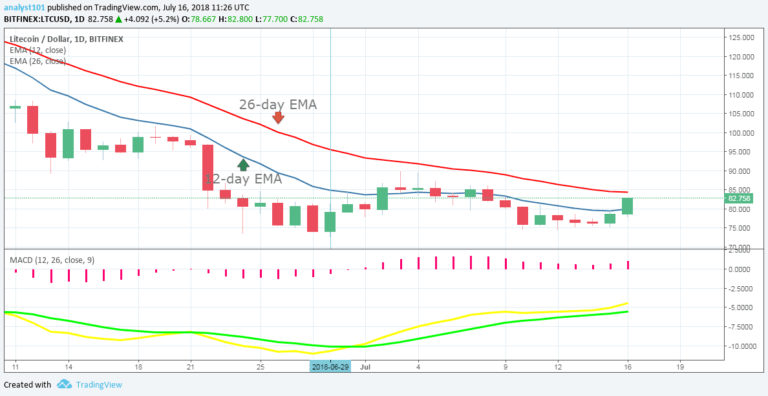
LTCUSD Medium-term Trend: Bearish
Resistance levels: $83, $85, $87
Support levels: $80, $78, $76
Last week the price of Litecoin was in a bearish trend. The cryptocurrency fell from the high of $83.40 to the low of $75.53. There was an assumption last week that if the bears broke the previous low at $74.01, the price of Litecoin would find another support at $59.43.
From the daily chart, the MACD line and the signal line are below the zero line which indicates a sell signal. Also, the 12-day EMA and the 26-day EMA are above the price bars of Litecoin which indicates that the bearish trend is ongoing.
LTCUSD Short-term Trend: Bullish
Litecoin Chart by Trading View
On the 4-hour chart, the price of Litecoin has commenced a bullish trend. The price of Litecoin is above the 12-day EMA and the 26-day EMA indicating that the price of Litecoin has risen. The relative strength index period 14 is level 70 which indicates that price is in the bullish trend zone.
The views and opinions expressed here do not reflect that of CryptoGlobe.com and do not constitute financial advice. Always do your own research.


