
 Litecoin Chart by Trading View
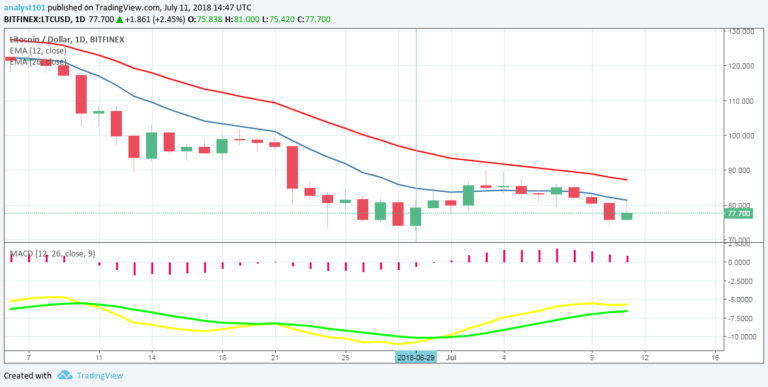
LTCUSD Medium-term Trend: Bearish
Resistance Levels: $79, $81, $83
Support Levels: $75, $73, $71
Yesterday, July 10, the Litecoin price was in a bearish trend. Litecoin fell to $75.04 and had a bullish movement. There are indications that the price will further decline despite its bullish movement. However, the MACD line and the signal line are below the zero line which indicates a sell signal.
In addition, the 12-day EMA and the 26-day EMA are above the price bars which indicates that the bearish trend is ongoing. Traders should look out for buy setups as the cryptocurrency finds its low.
LTCUSD Short-term Trend: Bearish
Litecoin Chart by Trading View
The 4-hour chart shows that the price is in a downward trend. The cryptocurrency fell to its low after its range-bound movement. The 12-day EMA and the 26-day EMA are trending southward. Meanwhile, the relative strength index period 14 is level 43 which indicates that the Litecoin price is in a range-bound zone.
The views and opinions expressed here do not reflect that of CryptoGlobe.com and do not constitute financial advice. Always do your own research.


