

Ethereum Medium-term Trend: Bullish
Supply zones: $600, $650, $700
Demand zones: $350, $300, $250
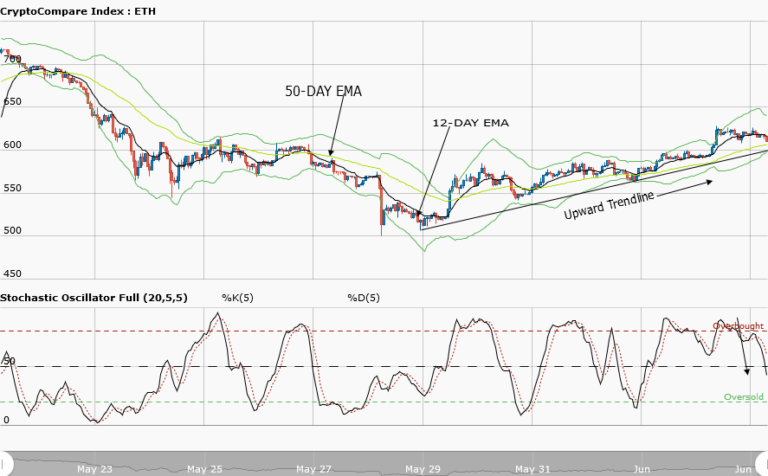
Ethereum continues in bullish trend in the medium-term outlook. The bearish pressure pushed the cryptocurrency to $451.37 in the demand area. This is above the 50-day EMA and within the 50.0 fib level. The 50.0 and 68.1 fib level are good trend reversal areas. The formation of bullish candles around these areas are indications that the bulls are back to push price further north.
The stochastic oscillator is at 41 percent with signal pointing up suggesting upward movement in the price of the cryptocurrency due to the bulls increased momentum and pressure.
Ethereum short-term Trend: Bullish

The cryptoasset continues in bullish trend in the short-term outlook. Although the bears were in control at the opening of market pushing price down to $451.27 in the demand area. It was a retest of the previous supply area now turned demand area.
The formation of the bullish hammer, a reversal candle pattern signals the bulls return. Price was push up to $467.94 in the supply area. This is above the two EMAs. The stochastic oscillator is at 61 percent and signals pointing up. This suggests upward movement on the price of the cryptocurrency as the bulls increase their pressure.
The views and opinions expressed here do not reflect that of CryptoGlobe.com and do not constitute financial advice. Always do your own research.


