
ETHUSD Long-term Trend – Bearish
Distribution territories: $700.00, $800.00, $900.00.
Accumulation territories: $300.00, $200.00, $100.00.
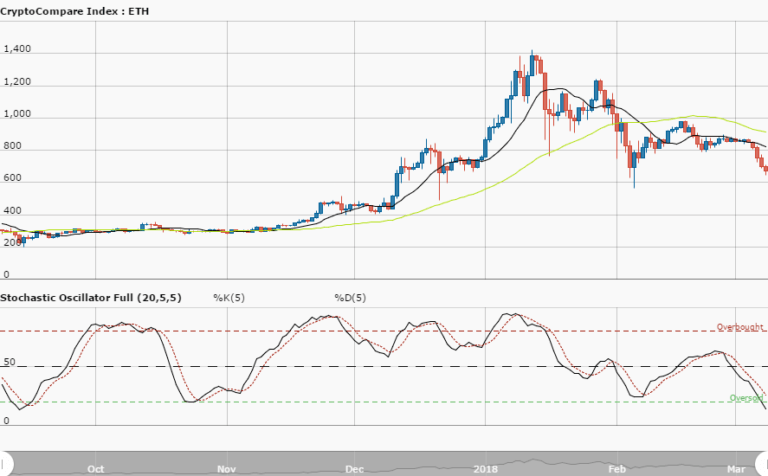
Ethereum hasn’t been able to recover from the selling pressure it has been enduring in its pair with the US dollar. Throughout last week, the crypto asset was declining in a ranging format to the extent of being below the trend-line of the 14-day SMA. The bearish market trend continues to favor the bears’ presence largely as the bulls have still not been able to gain the upper hand.

A confluence of about four or five Japanese candlesticks has occurred below the trend-line of the 14-day SMA. The price is fluctuating below the distribution territory of $400.00. The 50-day SMA is located above the 14-day SMA.
This signifies that the bears are relaxing their strength. The Stochastic Oscillators have been slowly plunging into the oversold zone, and are very lightly bent northwards. This suggests that selling action is getting less severe.
The digital asset may in the long run be driven towards the last lowest price it had close to April 6. The bullish market may have to find the genuine foundations of a bearish reversal to substantiate its possibility of coming back. The sentiment has been that the market needs to be driven a bit southward to determine a decent long entry.
The views and opinions expressed here do not reflect that of CryptoGlobe.com and do not constitute financial advice. Always do your own research


