Ethereum Price Medium-term Trend: Ranging
Supply zones: $600, $650, $700
Demand zones: $300, $250, $200
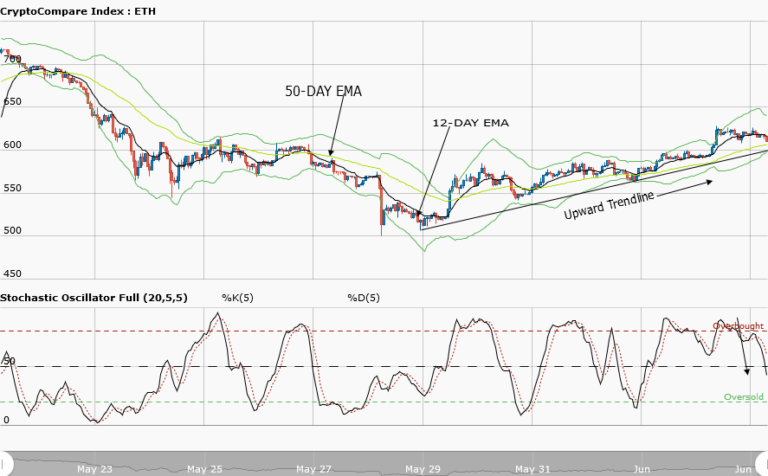
ETH continues ranging in the medium-term outlook. The bears’ pressure was sustained within the range as the cryptocurrency was down to $458.74 in the demand area below the two EMAs
The price is currently below the two EMAs with the Stochastic oscillator in the oversold region at 17%. Its signal is pointing down. These imply strong bearish pressure in the medium-term.
The structure of the market is a M formation and the completion of the right leg as the bears’ momentum may likely occur.
ETH is in consolidation and is trading between $481.55 in the supply area of the upper price range and at $444.45 in the demand area of the lower price range. Patience will always pay off in this instance as a breakout from the upper price range or a breakdown at the lower price range will occur soon thereafter a position can be taken.
Ethereum Price Short-term Trend: Bearish
ETH is in a bearish trend in the short-term outlook. The strong bearish pressure continued as the two EMAs were broken before the close of yesterday’s market and the price went down to $458.74 in the demand area.
The double top formation has been largely respnsible for the increased bear pressure.
The daily opening candle though was a bullish spinning top but could only push to $467.30 in the supply area. The upward rejection price was seen at the 12-day EMA.
The stochastic oscillator is in the oversold region at 15% and its signal points down which implies a downward price movement of the cryptocurrency as the bears’ momentum increase. $449.40 may likely be the bears’ target in the short-term.
The views and opinions expressed here do not reflect that of CryptoGlobe.com and do not constitute financial advice. Always do your own research.


