
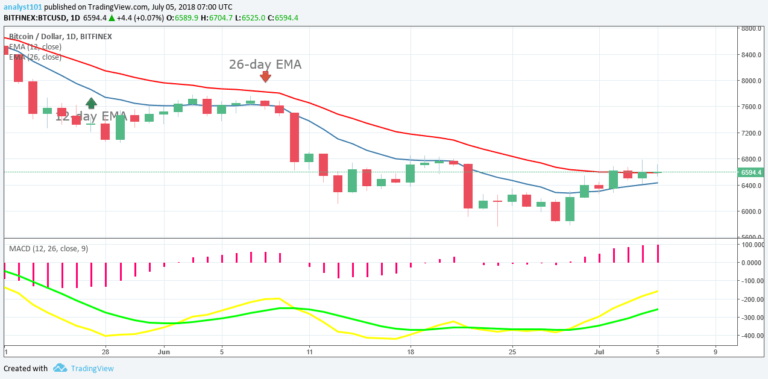

BTCUSD Medium-term Trend: Bearish
Resistance Levels: $6,700, $6,800, $6,900
Support Levels: $6,500, $6,400, $ 6,300
Yesterday, July 4, price of Bitcoin was bearish in the medium term trend. The price of the cryptoasset ended its downward trend on the June 29, at a closing price of $5893.51. Today, price of Bitcoin has reached the high of $6,607.50 in its bullish trend. This is about 12.11% price increase.
However, if price breaks the $6,600 price level, the cryptoasset is likely to reach the high of $7,000. Nevertheless, the MACD line and the signal line are still below the zero line which indicates a sell signal. Whereas, the 12- day and the 26-day EMA are above the price bars of Bitcoin which indicates that the cryptoasset is in a downtrend trend .
BTCUSD Short-term Trend: Bullish

On the 4-hour chart, the price of Bitcoin is in a bullish trend. The price bars of Bitcoin is above the 12- day EMA and the 26-day EMA indicating that price of Bitcoin is bullish. A bullish trend line is attached to the chart and it shows the support levels of price of Bitcoin . Traders can use the trend line to trade their digital currencies.
From the chart, the red bearish candlestick retraces and tests the trend line. After testing the trend line and the bearish candlestick closes, then you can initiate a long order. Meanwhile, the MACD line and the signal line are above the zero line which indicates a buy signal.
The views and opinions expressed here do not reflect that of CryptoGlobe.com and do not constitute financial advice. Always do your own research


