

BTCUSD Medium-term Trend: Bearish
Resistance Levels: $6,600, $6,700, $6,800
Support Levels: $6,200, $6,100, $ 6,000
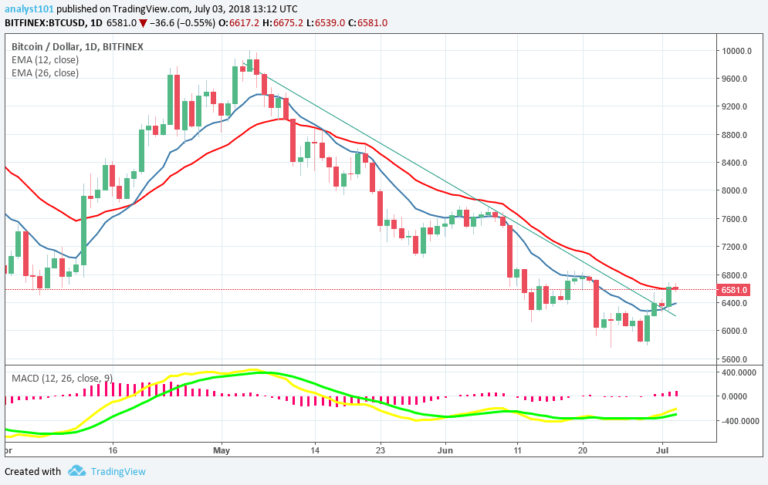
Yesterday, July 2, price of Bitcoin was in a bearish trend. A bearish trend line has been drawn to determine when the bearish pressure will be over. The price of the cryptoasset is currently in a range bound movement. However, the price of Bitcoin has broken the bearish trend line.
Meanwhile, the MACD line and the signal line are below the zero line which indicates a sell signal. Also, the 12-day and the 26-day EMA are above the price bars of Bitcoin which indicates that the bearish trend is continuing.
BTCUSD Short-term Trend: Bullish

On the 4-hour chart, the price of Bitcoin is in a bullish trend. The 12- day EMA and the 26-day EMA are trending northward. Meanwhile, the relative strength index period 14 is level 61 which indicates that price of Bitcoin is in the bullish trend zone.
The views and opinions expressed here do not reflect that of CryptoGlobe.com and do not constitute financial advice. Always do your own research.


