

BTCUSD Medium-term Trend: Bearish
Resistance Levels: $6,400, $6,500, $6,600
Support Levels: $6,200, $6,100, $ 6,000
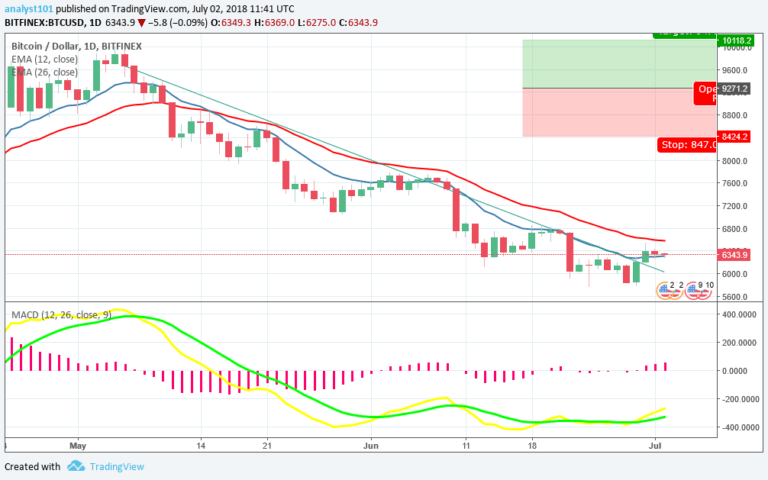
Last week, price of Bitcoin was in a bearish trend. The bulls were consistent as they sustained and traded above the $6,000 price level. Technically, it is assumed that a bearish trend is over, if a bullish candlestick breaks and closes on the opposite side of the trend line.
Meanwhile, the MACD line and the signal line are below the zero line which indicates a sell signal. Also, the 26-day EMA is above the price bars of Bitcoin which indicates that the bearish trend is continuing.
BTCUSD Short-term Trend: Bullish

On the 4-hour chart, the price of Bitcoin is in a bullish trend. On the shorter time frame, the cryptoasset made a bullish movement from its low of $5858.84 to the price above $6,000. The price bars of Bitcoin are above the 12-day EMA and the 26-day EMA indicating the rise of the price of Bitcoin. Meanwhile, the relative strength index period 14 is level 58 which indicates that price is almost at the bullish trend zone.
The views and opinions expressed here do not reflect that of CryptoGlobe.com and do not constitute financial advice. Always do your own research.


