

Bitcoin Price Medium-term Trend: Ranging
Resistance levels: $8,200, $8,300, $8,400
Support levels: $8,000, $7,900, $7,800
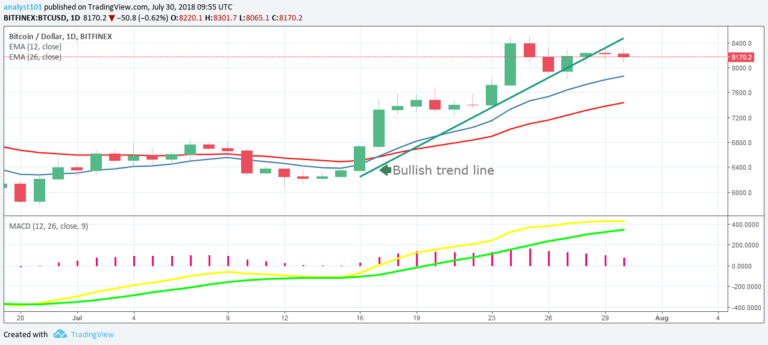
Last week the Bitcoin price was in a bullish trend. The cryptocurrency reached the high of $8,350 and was resisted by the bears at a price of $8,400. The price also broke the trend line giving way to the current range-bound movement. Today, the BTC price is in a range-bound movement.The bulls have a hurdle to cross at the $8,500 or $8,566 price level.
If the bulls break the resistance at those levels the price of Bitcoin will rally at the $10,000 price level. Meanwhile, traders can initiate long trades at the current market price. If the bulls fail to break the resistance level at $8,500, traders can exit their trades and have partial profits at $8,400. Nevertheless, the MACD line and the signal line are above the zero line which indicates a buy signal.
Also, the price of Bitcoin is above the 12-day EMA and the 26-day EMA which indicates that the bullish trend is ongoing.
Bitcoin Price Short-term Trend: Ranging

On the 4-hour chart, the Bitcoin price is in a range bound movement and moving in a horizontal pattern. Traders may not be able to profit in a choppy price action and may wish to suspend trading. Meanwhile, the Relative Strength Index period 14 is level 50 which indicates that the price of Bitcoin is in the range bound zone.
The views and opinions expressed here do not reflect that of CryptoGlobe.com and do not constitute financial advice. Always do your own research.


