

Bitcoin Price Medium-term Trend: Bullish
Resistance levels: $8,000, $8,100, $8,200
Support levels: $7,900, $7,800, $7,700
Yesterday, July 26th, the Bitcoin price was in a downward trend. The bulls recently took the price to $8,385.20 before they encountered resistance at $8,400. If the $8,400 price level was broken, Bitcoin could rally to $9,000 or $10,000 levels. However, the price fell to $7,878.30, which is about 6% depreciation.
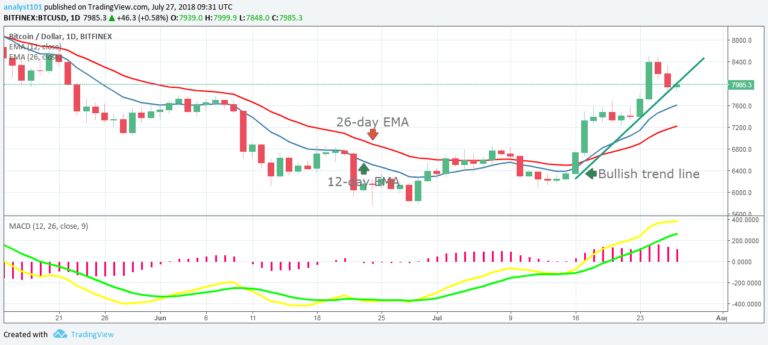
Also, note that the BTC price broke the trend line and the candlestick closed on the opposite of the trend line. It is likely the bullish trend may have changed to a range-bound movement. Traders may have to wait for a clearer picture of the market. Nevertheless, the MACD line and the signal line are above the zero line which indicates a buy signal.
Also,the price of Bitcoin is above the 12-day EMA and the 26-day EMA which indicates that the bullish trend is ongoing.
Bitcoin Price Short-term Trend: Bullish
On the 4-hour chart, the Bitcoin price shows an expanded view of the bearish trend. The price broke the trend line and two bullish candlesticks on a range-bound movement. Meanwhile, the Relative Strength Index period 14 is level 48 which indicates that Bitcoin is in the range-bound zone.
The views and opinions expressed here do not reflect that of CryptoGlobe.com and do not constitute financial advice. Always do your own research.


