

Bitcoin Price Medium-term Trend: Bullish
Resistance levels: $8,300, $8,400, $8,500
Support levels: $8,100, $8,000, $7,900
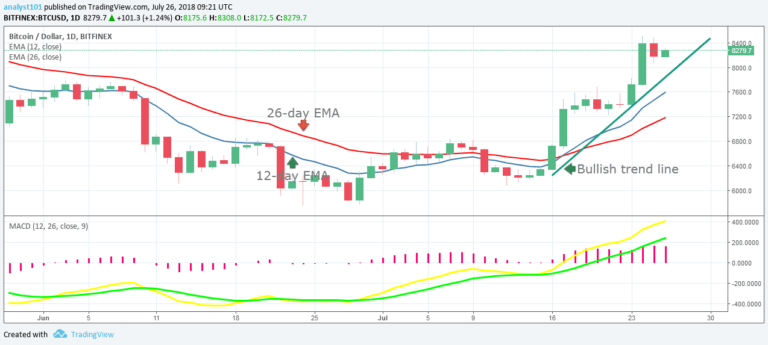
Yesterday, July 25th, the Bitcoin price was in a bullish trend, bitcoin retraced to the low of $8,140.50 and resumed its bullish movement on the 12-day EMA. Traders can initiate long trades at the current market price.
It is likely that the bulls may face resistance at the $8,500 and $9,000 price level. If the bulls break the $8,500 price level, the Bitcoin price will reach the high of $10,000 with little resistance at the $9,000 price level. If the bulls fail traders should exit their trades around the $8,500 price level.
Nevertheless, the MACD line and the signal line are above the zero line which indicates a buy signal. Also, the price of Bitcoin is above the 12-day EMA and the 26-day EMA which indicates that the bullish trend is ongoing.
Bitcoin Price Short-term Trend: Bullish.

On the 4-hour chart, the price of Bitcoin is in a smooth uptrend. The 12-day EMA and the 26-day EMA are trending northward indicating the rise of Bitcoin price. Meanwhile, the RSI period 14 is level 68 which indicates that the price of Bitcoin is in the bullish trend zone.
The views and opinions expressed here do not reflect that of CryptoGlobe.com and do not constitute financial advice. Always do your own research.


