

Bitcoin Price Medium-term Trend: Bullish
Resistance levels: $8,200, $8,300, $8,400
Support levels: $7,900, $7,800, $7,700
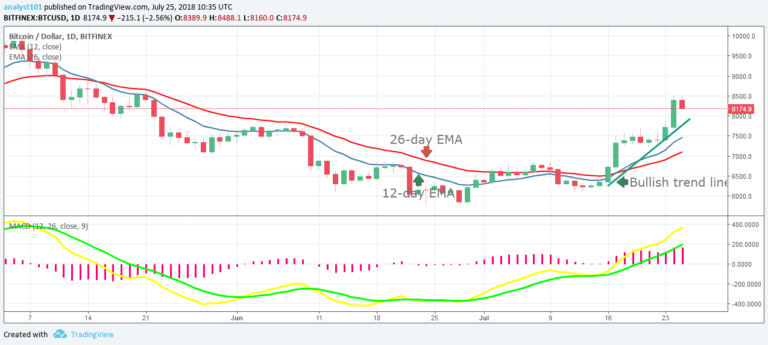
Yesterday, July 24th, the Bitcoin price was in a bullish trend. Meanwhile, we are examining the trend line tool to determine the continuity of the bullish trend and its reversal.The Bitcoin price is retracing from the high of $8,426.62 to test the bullish trend line.
If the cryptocurrency tests the trend line and rebounds then the BTC price will continue its bullish trend. If the BTC price breaks the trend line and the candlestick closed on the opposite of the trend line; then the current trend is over. Meanwhile, the MACD line and the signal line are above the zero line which indicates a buy signal.
Nevertheless, if price retraces from the recent high and tests the trend line traders should initiate long trades, Also, the price of Bitcoin is above the 12-day EMA and the 26-day EMA which indicates that the bullish trend is ongoing.
Bitcoin Price Short-term Trend: Bullish

On the 4-hour chart, we have the expanded view of Bitcoin price retracement. The RSI period 14 is level 66 which indicates that the price of Bitcoin is in the bullish trend zone.The cryptocurrency is likely to continue its bullish movement.
The views and opinions expressed here do not reflect that of CryptoGlobe.com and do not constitute financial advice. Always do your own research.


