

Bitcoin Pice Medium-term Trend: Bullish
Resistance levels: $7,800, $7,900, $8,000
Support levels: $7,500, $7,400, $7,300
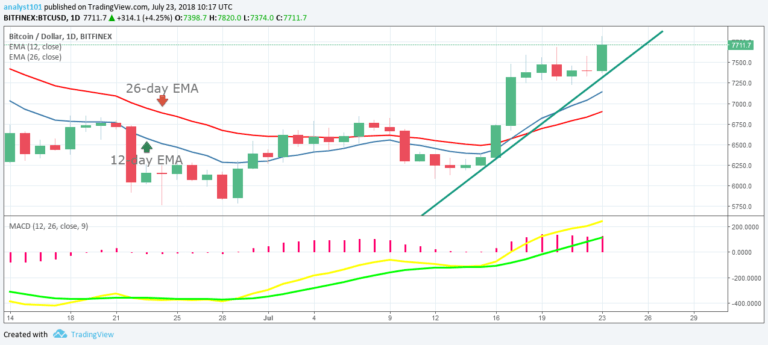
Last week, July 15th, the price of Bitcoin had its first bullish trend. Today the price of Bitcoin has resumed its bullish movement and it is attempting to reach the high of $8,000.
Meanwhile, a bullish trend line has been drawn showing the support levels of price where traders can initiate long trades. For instance, if price retraces from the recent high and tests the trend line without breaking it, you can initiate long trades. Meanwhile, the MACD line and the signal line are above the zero line which indicates a buy signal.
Also, the price of Bitcoin is above the 12-day EMA and the 26-day EMA which indicates that the bullish trend is ongoing.
Bitcoin Price Short-term Trend: Bullish.

On the 4-hour chart, the price of Bitcoin shows the initial bullish trend, the range-bound movement, and the current bullish trend. On the 4-hour chart, the price of Bitcoin is above the 12-day EMA and the 26-day EMA which indicates that Bitcoin price is rising. Meanwhile, the RSI period 14 is level 68 which indicates that price is in the bullish trend zone.
The views and opinions expressed here do not reflect that of CryptoGlobe.com and do not constitute financial advice. Always do your own research.


