

BTCUSD Medium-term Trend: Ranging
Resistance levels: $7,500, $7,600, $7,700
Support levels: $7,300, $7,200, $7,100
Yesterday, July 19th, the price of Bitcoin was in a range bound movement. Bitcoin price has been in a range bound movement since July 17, fluctuating between the levels of $7,343 and $7,454. As the price of Bitcoin is fluctuating, traders will not be able to trade the cryptocurrency because the key levels are not evenly apart and Bitcoin has a choppy price action.
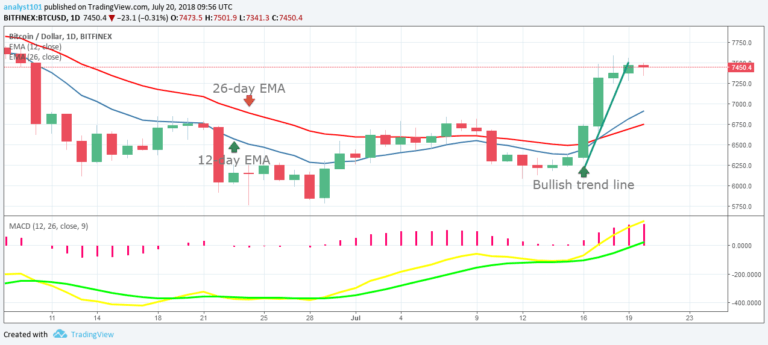
Meanwhile, the MACD line and the signal line are above the zero line which indicates a buy signal. Also, the price of Bitcoin is above the 12-day EMA and the 26-day EMA which indicates that the Bitcoin price is rising.
BTCUSD Short-term Trend: Bullish

On the 4-hour chart, the price of Bitcoin is in a range bound movement. From the chart, the price of Bitcoin is fluctuating and moving in a horizontal pattern. Meanwhile, the RSI period 14 is level 75 which indicates that the market is overbought suggesting bears to take control of the market. This implies that we should exit our long trades while we wait for another buying opportunity.
The views and opinions expressed here do not reflect that of CryptoGlobe.com and do not constitute financial advice. Always do your own research.


