

BTCUSD Medium-term Trend: Bearish
Resistance levels: $6,400, $6,500, $6,600
Support levels: $6,200, $6,100, $6,000
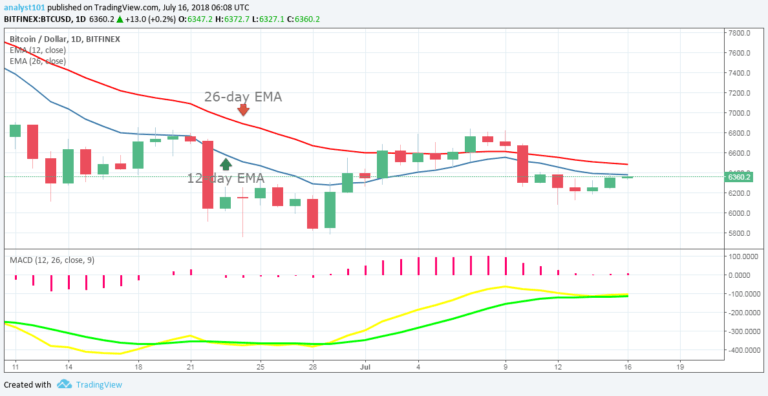
Last week, the price of Bitcoin was in a bearish trend. The MACD line and the signal line are below the zero line which indicates a sell signal. Also, the 12-day EMA and the 26-day EMA are above the price bars of Bitcoin which indicate that the bearish trend is ongoing.
However, volatility has reached a 6 month low indicating that a reversal in the medium to long term trend may occur soon.
BTCUSD Short-term Trend: Bullish

On the 4-hour chart, the price of Bitcoin has commenced a bullish movement. The price bars of Bitcoin are above the 12-day EMA and the 26-day EMA which indicates that the price of Bitcoin is bullish. The relative strength index period 14 is level 58 which indicates that price is almost at the bullish trend.
The views and opinions expressed here do not reflect that of CryptoGlobe.com and do not constitute financial advice. Always do your own research.


