

BTCUSD Medium-term Trend: Bearish
Resistance Levels: $6,600, $6,700, $6,800
Support Levels: $6,400, $6,300, $ 6,200
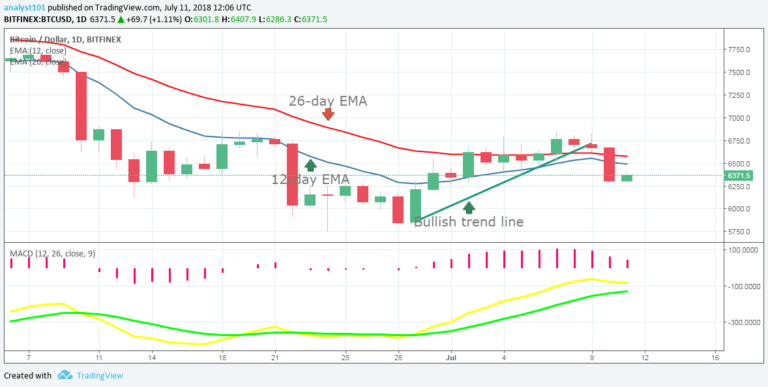
Yesterday, July 10, the price of Bitcoin was in a bearish trend as it retraced from its recent high of $6,719.30 to test the bullish trend line. The cryptocurrency had tested and broken the trend line thus ending the previous bullish trend. Today, the Bitcoin price has a bearish outlook as price fell to the previous low of $6,253.31.
There are indications that price of Bitcoin may further decline to the $6,000 price level. Meanwhile, the MACD line and the signal line are below the zero line which indicates a sell signal. In addition, the 12-day EMA and the 26-day EMA are above the price bars of Bitcoin which indicates that the bearish trend is ongoing.
BTCUSD Short-term Trend: Bearish.

On the 4-hour chart, the price of Bitcoin is in a downward trend. The cryptocurrency fell to the previous low and commenced a range bound movement. Meanwhile, the relative strength index period 14 is level 31 which indicates the market is oversold suggesting bulls to take control of the market.
The views and opinions expressed here do not reflect that of CryptoGlobe.com and do not constitute financial advice. Always do your own research.


