

XRPUSD Medium-term Trend: Bearish
Supply Levels: $0.67, $0.68, $ 0.69
Demand levels: $0.65, $0.64, $0.63
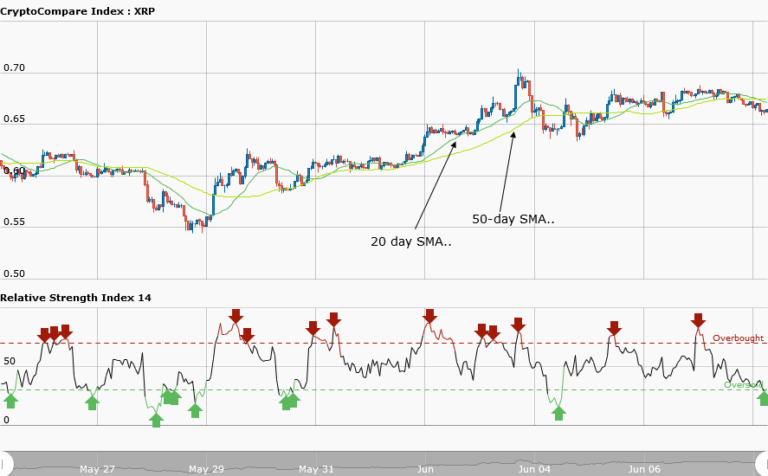
Yesterday, June 7, the XRPUSD pair was in a smooth uptrend where the asset was making a series of higher highs and higher lows. Yesterday, the Ripple price retraced from the recent high, tested the bullish trend line, and a support level was created. All the tested areas with pointed arrows are the support levels where traders can place long trades. However, the asset was yet to break the resistance level at $0.70.
Ripple was trading at $0.66 at the time of writing. Today, Ripple is in a bearish trend. The bulls were resisted at $0.68. However, if the selling pressure continues, the asset will find support at $0.65. Meanwhile, relative strength index period 14 is level 30 indicating that the market is oversold and suggesting the bulls will take control of the market.
XRPUSD Short-term Trend: Bearish

The daily chart shows the Ripple price in a smooth downtrend. Ripple was making a series of lower highs and lower lows. The downtrend was symbolic so you can short your trade at the different resistance levels. The asset price fell from $0.68 to $0.66
The views and opinions expressed here do not reflect that of CryptoGlobe.com and do not constitute financial advice. Always do your own research.


