

XRPUSD Medium-term Trend: Bullish
Supply Levels: $0.68, $0.69, $ 0.70
Demand levels: $0.66, $0.65, $0.64
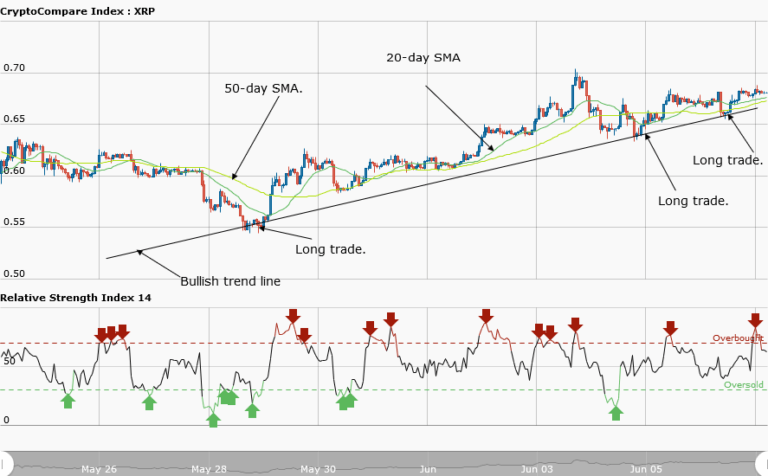
Yesterday, June 6, the XRPUSD pair was in a bullish trend. It was assumed that if the resistance level of price was broken, price of Ripple would reach the high of $0.80. Presently, Ripple is trading at $0.68 as at the time of writing.From the weekly chart, price of Ripple is in a smooth uptrend. Price of the asset is making a series of higher highs and higher lows.
However, as the asset makes a bullish movement, support levels are created. A bullish trend line is drawn across the price bars of Ripple showing support levels with pointed arrows. Traders can trade upon the support levels, However, in the absence of a trend line, you can trade the pure price action of the asset.
In the other words, when price retraces from the recent high, support levels are created as the price pulls back. Also, in a bullish trend, you can buy low and sell high. Meanwhile, the relative strength index period 14 is level 62 indicates that price of the asset is in the bullish trend zone.
XRPUSD Short-term Trend: Bullish

On the daily chart, price of Ripple is in a bullish trend. At a price of $0.65, the asset rose to the high of $0.68. Meanwhile, Ripple has not been able to break the resistance level at $0.70.
The views and opinions expressed here do not reflect that of CryptoGlobe.com and do not constitute financial advice. Always do your own research.


