

XRPUSD Medium-term Trend: Ranging
Supply Levels: $0.65, $0.66, $ 0.67
Demand levels: $0.63, $0.62, $0.61
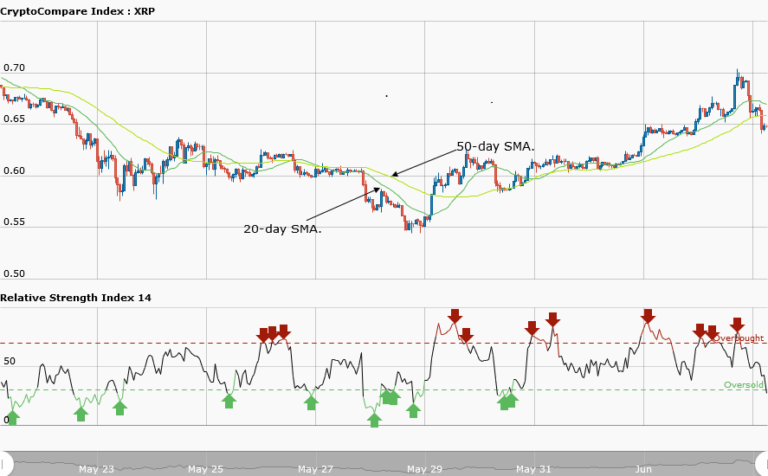
Last week, the price of Ripple was fluctuating from the support level at $0.55 to the resistance level at $0.65. Most of the time the asset was trading above and below the price of $0.60. Last week, when the asset was above the price of $0.60 it was resisted at $0.62. However, when it fell – it was to the low of $0.59 – only to make a comeback to the price of $0.60.
Ripple is currently trading at $0.64 as at the time of writing . From the weekly chart, the price broke the range bound zone that was created since May 23rd – i.e. the support level at $0.55 and the resistance level at $0.65. The asset broke the resistance level at $0.65 and rose to the high of $0.70, but the price pulled back again to the low of $0.65 .
Meanwhile, the relative strength index period 14 is level 26 indicating that the market is oversold – which suggests bulls will take control of the market. The price of Ripple may stabilize at the price of $0.65 as the market seems to be oversold.
XRPUSD Short-term Trend: Ranging

On the daily chart, the price of Ripple is in a ranging market. The price was ranging at $0.67 but made a bullish movement to the high of $0.70. The asset fell again to the low of $0.64.
The views and opinions expressed here do not reflect that of CryptoGlobe.com and do not constitute financial advice. Always do your own research.


