
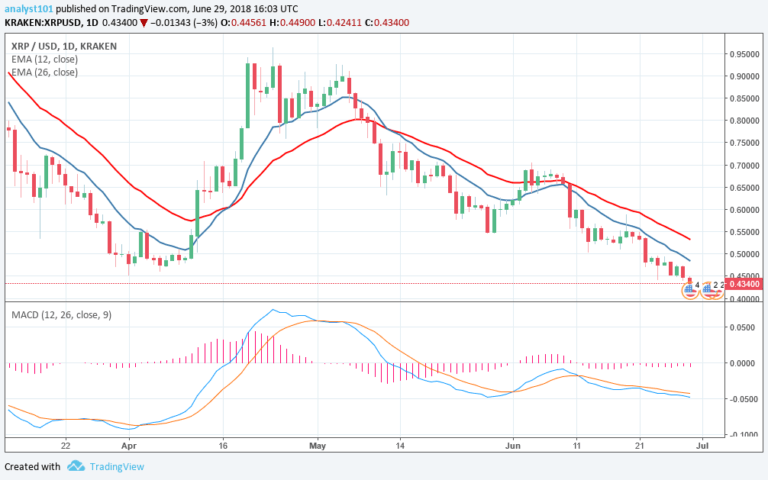

XRPUSD Medium-term Trend: Bearish
Supply Levels: $0.46, $0.47, $ 0.48
Demand levels: $0.44, $0.43, $0.42
Yesterday, June 28, Ripple was in a bearish trend. The cryptoasset was range bound between the levels of $0.50 and $0.44. Today, Ripple’s price has fallen to a previous low at $0.43. The assumption is that if its price breaks the support level at $0.44, it will find support at $0.24. Meanwhile, the MACD and signal lines are below the zero line which indicates a sell signal.
The 12-day EMA and the 26-day EMA are above the price of Ripple which indicates that the bearish trend is continuing.
XRPUSD Short-term Trend: Bearish

On the 4-hour chart, the price of Ripple is in a smooth downtrend. It is making a series of lower highs and lower lows. The 12-day EMA is below the 26-day EMA and trending southward. Meanwhile, the relative strength index period 14 is at 30 which indicates that the market is oversold, suggesting the bulls may take control.
The views and opinions expressed here do not reflect that of CryptoGlobe.com and do not constitute financial advice. Always do your own research.


