

XRPUSD Medium-term Trend: Bullish
Supply Levels: $0.52, $0.53, $ 0.54
Demand levels: $0.50, $0.49, $0.48
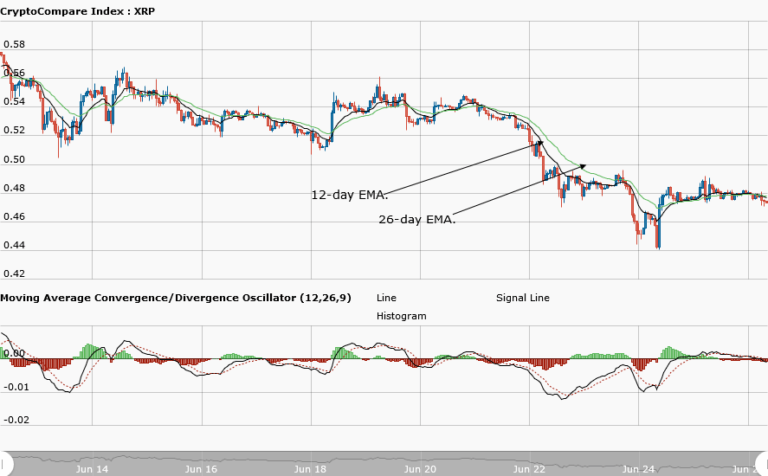
Yesterday, June 25, the Ripple price was in a bearish trend. The weekly chart shows that the cryptoasset fell to $0.44 but made a pullback to $0.48. The implication of this action is that the support level of $0.44 is the main support level. If Ripple has another bearish breakout, the main support level would be broken. In other words, there will be another support level at $0.24.
However, in a bullish breakout, the price will revisit the previous high. Meanwhile, the MACD line and the signal line are above the zero line which indicates a buy signal. Also, the price bars are above the 12-day EMA and 26-day EMA which indicates that the bullish trend is ongoing.
XRPUSD Short-term Trend: Ranging

The daily chart shows that the Ripple price is ranging between $0.47 and $0.48. The 20-day and 50-day moving averages are trending horizontally along with the price bars. Meanwhile, the relative strength index period 14 is level 48 which indicates that the price is in the range-bound zone.
The views and opinions expressed here do not reflect that of CryptoGlobe.com and do not constitute financial advice. Always do your own research.


