

Supply Levels: $0.49, $0.50, $ 0.51
Demand levels: $0.47, $0.46, $0.45
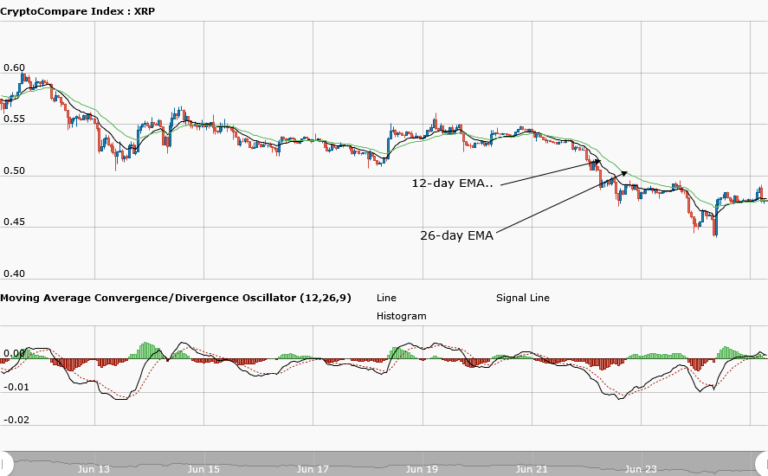
Last week, the Ripple cryptoasset was in a downward trend. The weekly chart shows that Ripple fell to its previous low at $0.44 on June 24, 2018. Thereafter, the cryptoasset made a pullback to $0.48. At $ 0.48, it started a range-bound movement. The Ripple price has reached the oversold region of the market. Traders should look out for buy setups in anticipation of a bullish trend.
Meanwhile, the MACD line and the signal line are above the zero line which indicates a buy signal. Also, the price bars are above the 12-day EMA and the 26-day EMA which indicates that the bullish trend is ongoing.
XRPUSD Short-term Trend: Ranging

The Daily chart shows that the Ripple price is in a range-bound movement. The 20-day moving average and 50-day moving average are trending horizontally at $0.48. Meanwhile, in the short-term trend, the relative strength index period 14 is level 75 which indicates that the market is overbought, suggesting the bears will take control of the market.
The views and opinions expressed here do not reflect that of CryptoGlobe.com and do not constitute financial advice. Always do your own research.


