

XRPUSD Medium-term Trend: Bearish
Supply Levels: $0.52, $0.53, $ 0.54
Demand levels: $0.50, $0.49, $0.48
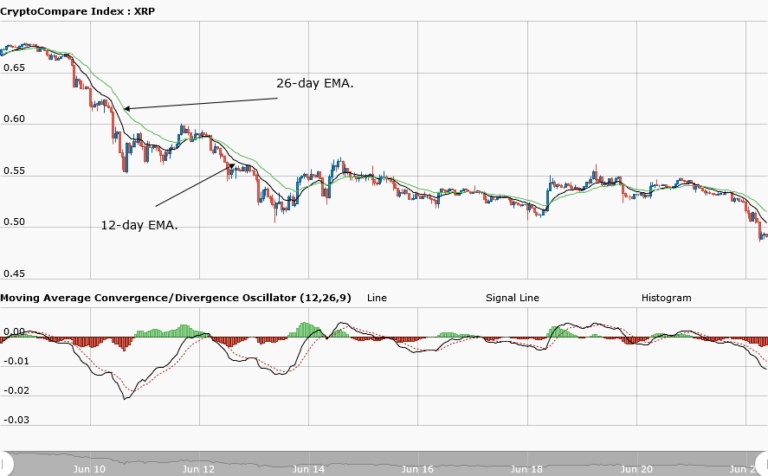
Yesterday, June 21, the Ripple price was in a range bound market. The cryptoasset closed trading at $0.53 on the second day. The weekly chart shows that the MACD line and the signal line are below the zero line, indicating a sell signal. Also, the Ripple price is below the 12-day EMA and the 26-day EMA, indicating that the bearish trend is ongoing.
The market is said to be oversold and traders should initiate buy setups so to initiate long trades.
XRPUSD Short-term Trend: Bearish

The daily chart shows Ripple in a bearish trend. The 20-day moving average and the 50-day moving average are trending southward. The cryptoasset fell from $0.53 to $0.49. However, if the price falls, the demand levels would be breached. The relative strength index period 14 is level 44 which, indicating that the price is in a range-bound zone.
The views and opinions expressed here do not reflect that of CryptoGlobe.com and do not constitute financial advice. Always do your own research.


