

XRPUSD Medium-term Trend: Bullish
Supply Levels: $0.52, $0.53, $ 0.54
Demand levels: $0.50, $0.49, $0.48
Yesterday, June 13, the Ripple price fell to $0.51 and the asset is still approaching the low registered in April, 2018. In today’s early hours, Ripple had a bullish movement which has since been truncated by the bears. The weekly chart shows that the Ripple price has broken the bearish trend line.
Technically, when the price breaks a trend line and the candlestick closes on the opposite of the trend line; it is assumed that the current trend is over. Meanwhile, the MACD line and the signal line are above the zero line which indicates a buy signal. In addition, Ripple’s price bars is above the 12-day EMA and the 26-day EMA, which indicates that the bullish trend is ongoing.
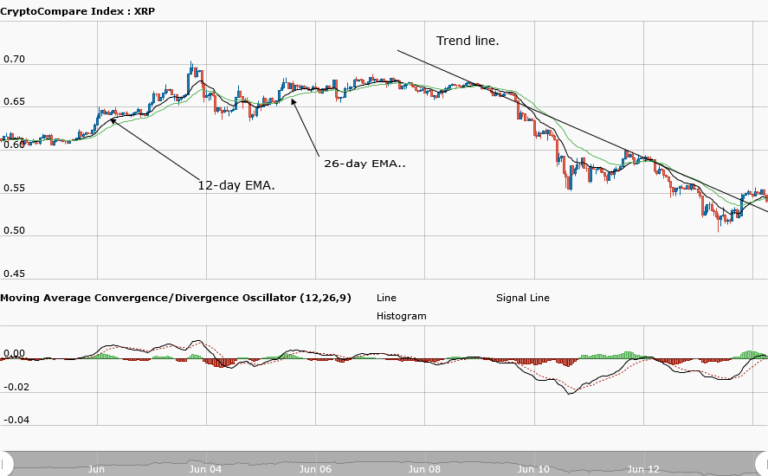
XRPUSD Short-term Trend: Bearish

The daily chart shows that the Ripple price was making a bullish movement to $0.55 before they were resisted by the bears. On the chart, the MACD line and the signal line are below the zero line, indicating a sell signal. Also, the 12-day EMA and the 26-day EMA are above Ripple’s price bars, indicating that the bearish trend is ongoing.
The views and opinions expressed here do not reflect that of CryptoGlobe.com and do not constitute financial advice. Always do your own research.


