

XRPUSD Medium-term Trend: Bearish
Supply Levels: $0.58, $0.59, $ 0.60
Demand levels: $0.56, $0.55, $0.54
Yesterday, June 11, price of Ripple fell to the low of $ 0.56. There were indications that the asset would slide down further to the lows of $0.55 and $0.50. From the weekly chart, the price at $0.55 is the support level where price has been consolidating after the bearish breakout.
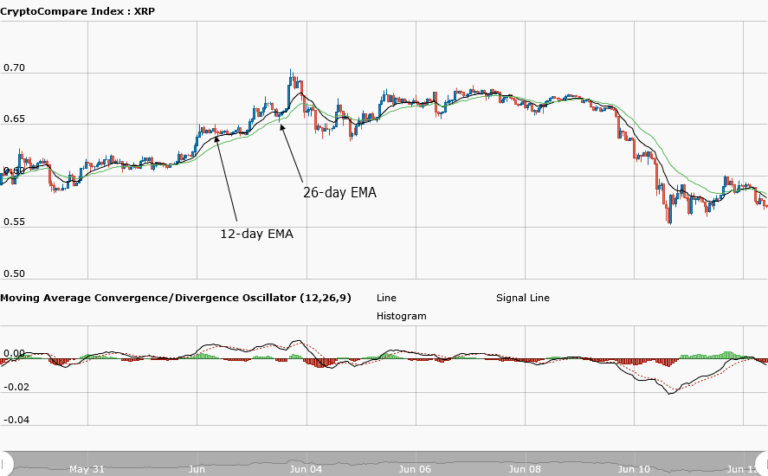
Meanwhile, the MACD line and the signal line are below the zero line which is a sell signal for the price of Ripple. Whereas the 12-day EMA and the 26-day EMA are neither below nor above the price bars of Ripple which gives us a neutral signal. The neutral signal means that it is not clear whether the bearish pressure will continue.
XRPUSD Short-term Trend: Bearish

On the daily chart, price of Ripple is in a bearish trend. On the short term trend, the MACD line and the signal line are below the zero line which indicates a sell signal. Also, the 12-day EMA and 26-day EMA are above the price bars of Ripple which indicates that the bearish trend is ongoing.
The views and opinions expressed here do not reflect that of CryptoGlobe.com and do not constitute financial advice. Always do your own research.


