
Last week’s analysis showed how sentiment data decreased significantly before the overall crypto market suffered price drops. Todays analysis will give an update on the overall market indicators along with how quantitative sentiment indicators behave on an individual level. For more graphs and cryptocurrency sentiment data check out the AltcoinAnalytics newsletter and receive detailed analysis.
AltcoinAnalytics Sentiment Indicator vs Crypto Market Capitalization

Sentiment in the graph above is calculated using algorithmic text analysis which classifies a Tweet as positive or negative on a scale from +1 to -1, this is done per individual tweet over 100+ cryptocurrencies. By looking at sentiment over time it establishes a baseline to see if sentiment is becoming more positive or more negative. As with all quantitative models, they will never be finished.
The chart above shows sentiment over time (upper) and total market cap across the entire crypto market (lower). Sentiment shows a slight uptick from mid-June but is still hovering around the 8-month historical lows. However, the most interesting part is that sentiment drops a few days before total marketcap drops.
Individual cryptos
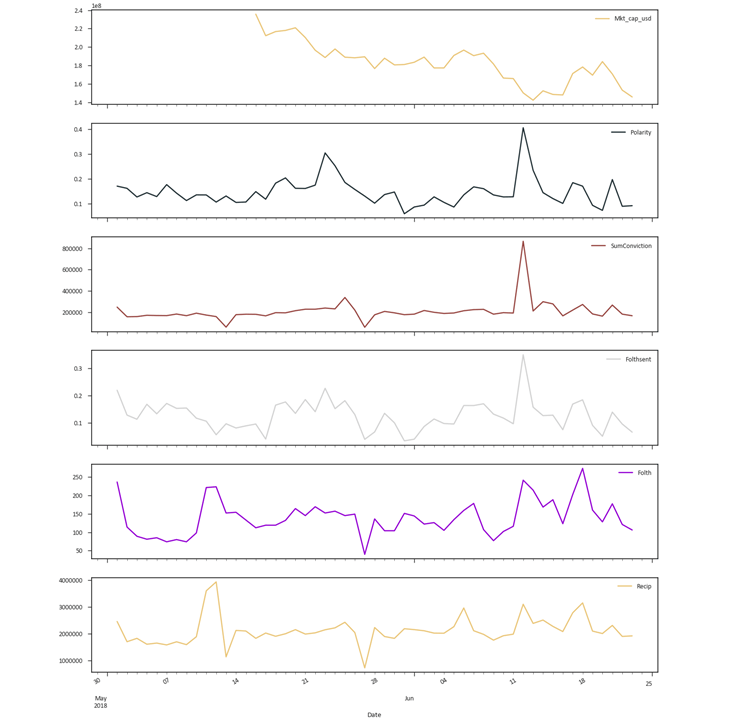
Taking a closer look at the micro level certain cryptoassets show trends. The individual Sentiment overview shows the following AltcoinAnalytics quantitative indicators over time:
- Market Capitalization
- Sentiment (polarity)
- SumConviction: Sentiment proxy taking in to regard exposure and certainty
- Folthsent: Sentiment of Tweets for which the author has a certain threshold of followers, this to put more weight in more followed Twitter accounts
- Folth: Exposure by Tweets with a certain threshold
- Recip: Tweets * followers, again a proxy for the Twitter exposure of a certain crypto
Reddcoin (RDD)

In this example Reddcoin (RDD) data is plotted. There is a clear spike on the sentiment and Twitter indicators in the chart above. This is followed by a 35% increase in the RDD market cap which is significant considering the established bear market. However, the spiked sentiment doesn’t persist and the current bear trend in market cap isn’t broken.


