

LTCUSD Medium-term Trend: Bearish
Resistance: $119, $120, $121
Support: $117, $116, $115
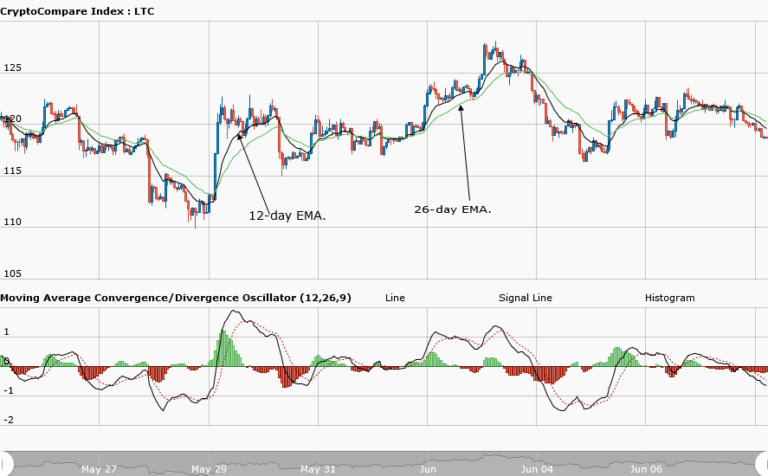
Yesterday, the Litecoin price was in a bullish trend. The bulls had been able to sustain the asset price above the $120 price level. Meanwhile, the MACD line and the signal line were above the zero line indicating a buy signal for the asset. The symbol of the histogram had turned from negative to positive because the asset was in a bullish trend.
The asset was trading at $118.68 at the time of writing. Today, the Litecoin price is in a bearish trend. The bulls no longer sustain the price above the $120 level. If the bearish trend continues, the asset price is likely to fall to the previous low of $117. Meanwhile, the MACD line and the signal line are below the zero line indicating a sell signal for the asset.
The 12-day EMA and 26-day EMA are above the price of Litecoin indicating that the bearish trend is ongoing.
LTCUSD Short-term Trend: Bearish

The daily chart shows the Litecoin price in a bearish trend. The price fell from $121.50 to $118.50. The MACD line and the signal line are deep below the zero line, indicating a sell signal.
The views and opinions expressed here do not reflect that of CryptoGlobe.com and do not constitute financial advice. Always do your own research.


