

LTCUSD Medium-term Trend: Bearish
Resistance: $119, $120, $121
Support: $117, $116, $115
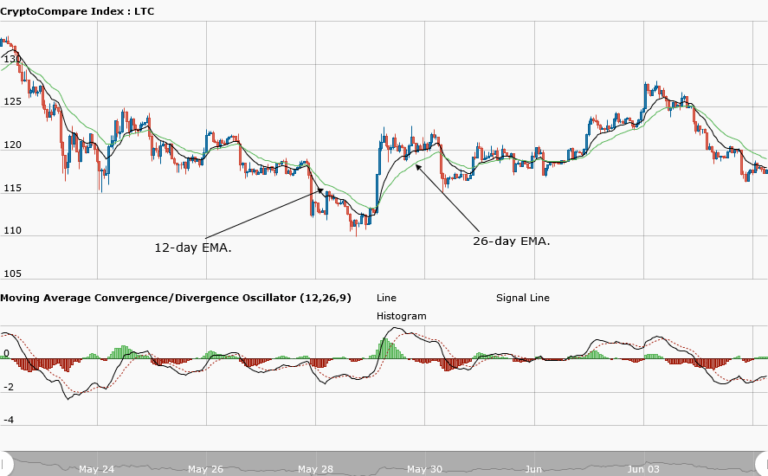
The price of Litecoin is still in the range bound zone; fluctuating from the support level at $110 to the resistance level at $125. The asset has made several efforts to trade above the $120 price level but has been resisted by the bears. However, yesterday the MACD line and the signal line were below the zero line indicating a sell signal.
The 12-day EMA and 26-day EMA were above the price of Litecoin indicating that the bearish trend was ongoing. The price of the asset is currently trading at $117.19 as at the time of writing. From the weekly chart, the price of Litecoin is still bearish as per the indicators. The MACD line and the signal line are below the zero line indicating a sell signal.
The bearish pressure on the asset is ongoing because the 12-day EMA and 26-day EMA are above the price of the asset. However, if the bearish pressure continued the asset will fall to the low of $110.
LTCUSD Short-term Trend: Ranging

On the daily chart, the price of Litecoin is in a ranging market. The MACD line and the signal line are almost neutral to the zero line. The asset ranges at the price of $119 but fell to the low of $117 to continue its range bound movement.
The views and opinions expressed here do not reflect that of CryptoGlobe.com and do not constitute financial advice. Always do your own research.


