

LTCUSD Medium-term Trend: Bearish
Resistance: $121, $122, $123
Support: $119, $118, $117
Last week, the LTCUSD pair was fluctuating from the support level at $110 to the resistance level at $125. The price of the asset was sustained above the $100 price level. The asset made an attempt to trade above the price of $120 but was resisted by the bears. Litecoin is currently trading at $ 120.53 as at the time of writing.
From the weekly chart, the MACD line and the signal line are below the zero line indicating a sell signal. Also, 12-day EMA and 26-day EMA are above the price of Litecoin indicating that the bearish trend is ongoing. However, if the bears break the support level at $120, then the price of Litecoin will fall to its previous low of $117.
LTCUSD Short-term Trend: Ranging

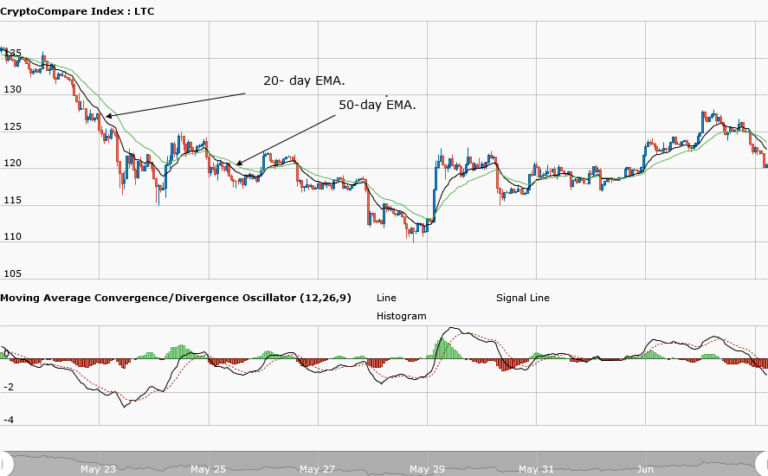
On the daily chart, the price of Litecoin is in a bearish market. The asset fell from the high of $127 to the support level at $120. On the daily chart, the MACD line and the signal line are below the zero line indicating a sell signal. The support levels will be breached if the asset falls below the support level of $120.
The views and opinions expressed here do not reflect that of CryptoGlobe.com and do not constitute financial advice. Always do your own research.


